
KubeBlocks for
ClickHouse
ClickHouse is a column-oriented OLAP database designed for real-time analytical queries on large datasets. It delivers exceptional query performance with high data compression, making it ideal for log analytics, time-series data, and business intelligence.
Supported versions
Available on
 AWS
AWS Azure
Azure GCP
GCP OCI
OCI Alibaba Cloud
 Rancher
 OpenShift
Databases
 MySQL
MySQL PostgreSQLOracle
 SQL Server
 Redis
Redis MongoDB
 ClickHouse
Vector & AI
 Qdrant
 Milvus
 Elasticsearch
Message queues
 RocketMQ
 RabbitMQ
 Kafka
KafkaOthers
 VictoriaMetrics
 InfluxDB
 etcd
etcd ZooKeeper
Extend database engines like plug-ins
KubeBlocks provides unified database operations through its addon-based architecture. With KubeBlocks Enterprise, access over 15 seamless integrations to scale your database services.
One control plane, consistent operations across all engines — powered by the addon mechanism.
Run ClickHouse with real lifecycle, scaling, tuning, and recovery workflows
Operate ClickHouse with guided creation, compute and storage scaling, file-based tuning, backup and restore, metrics, logs, IP whitelist controls, task history, and data-management workflows backed by real KubeBlocks Enterprise screens.
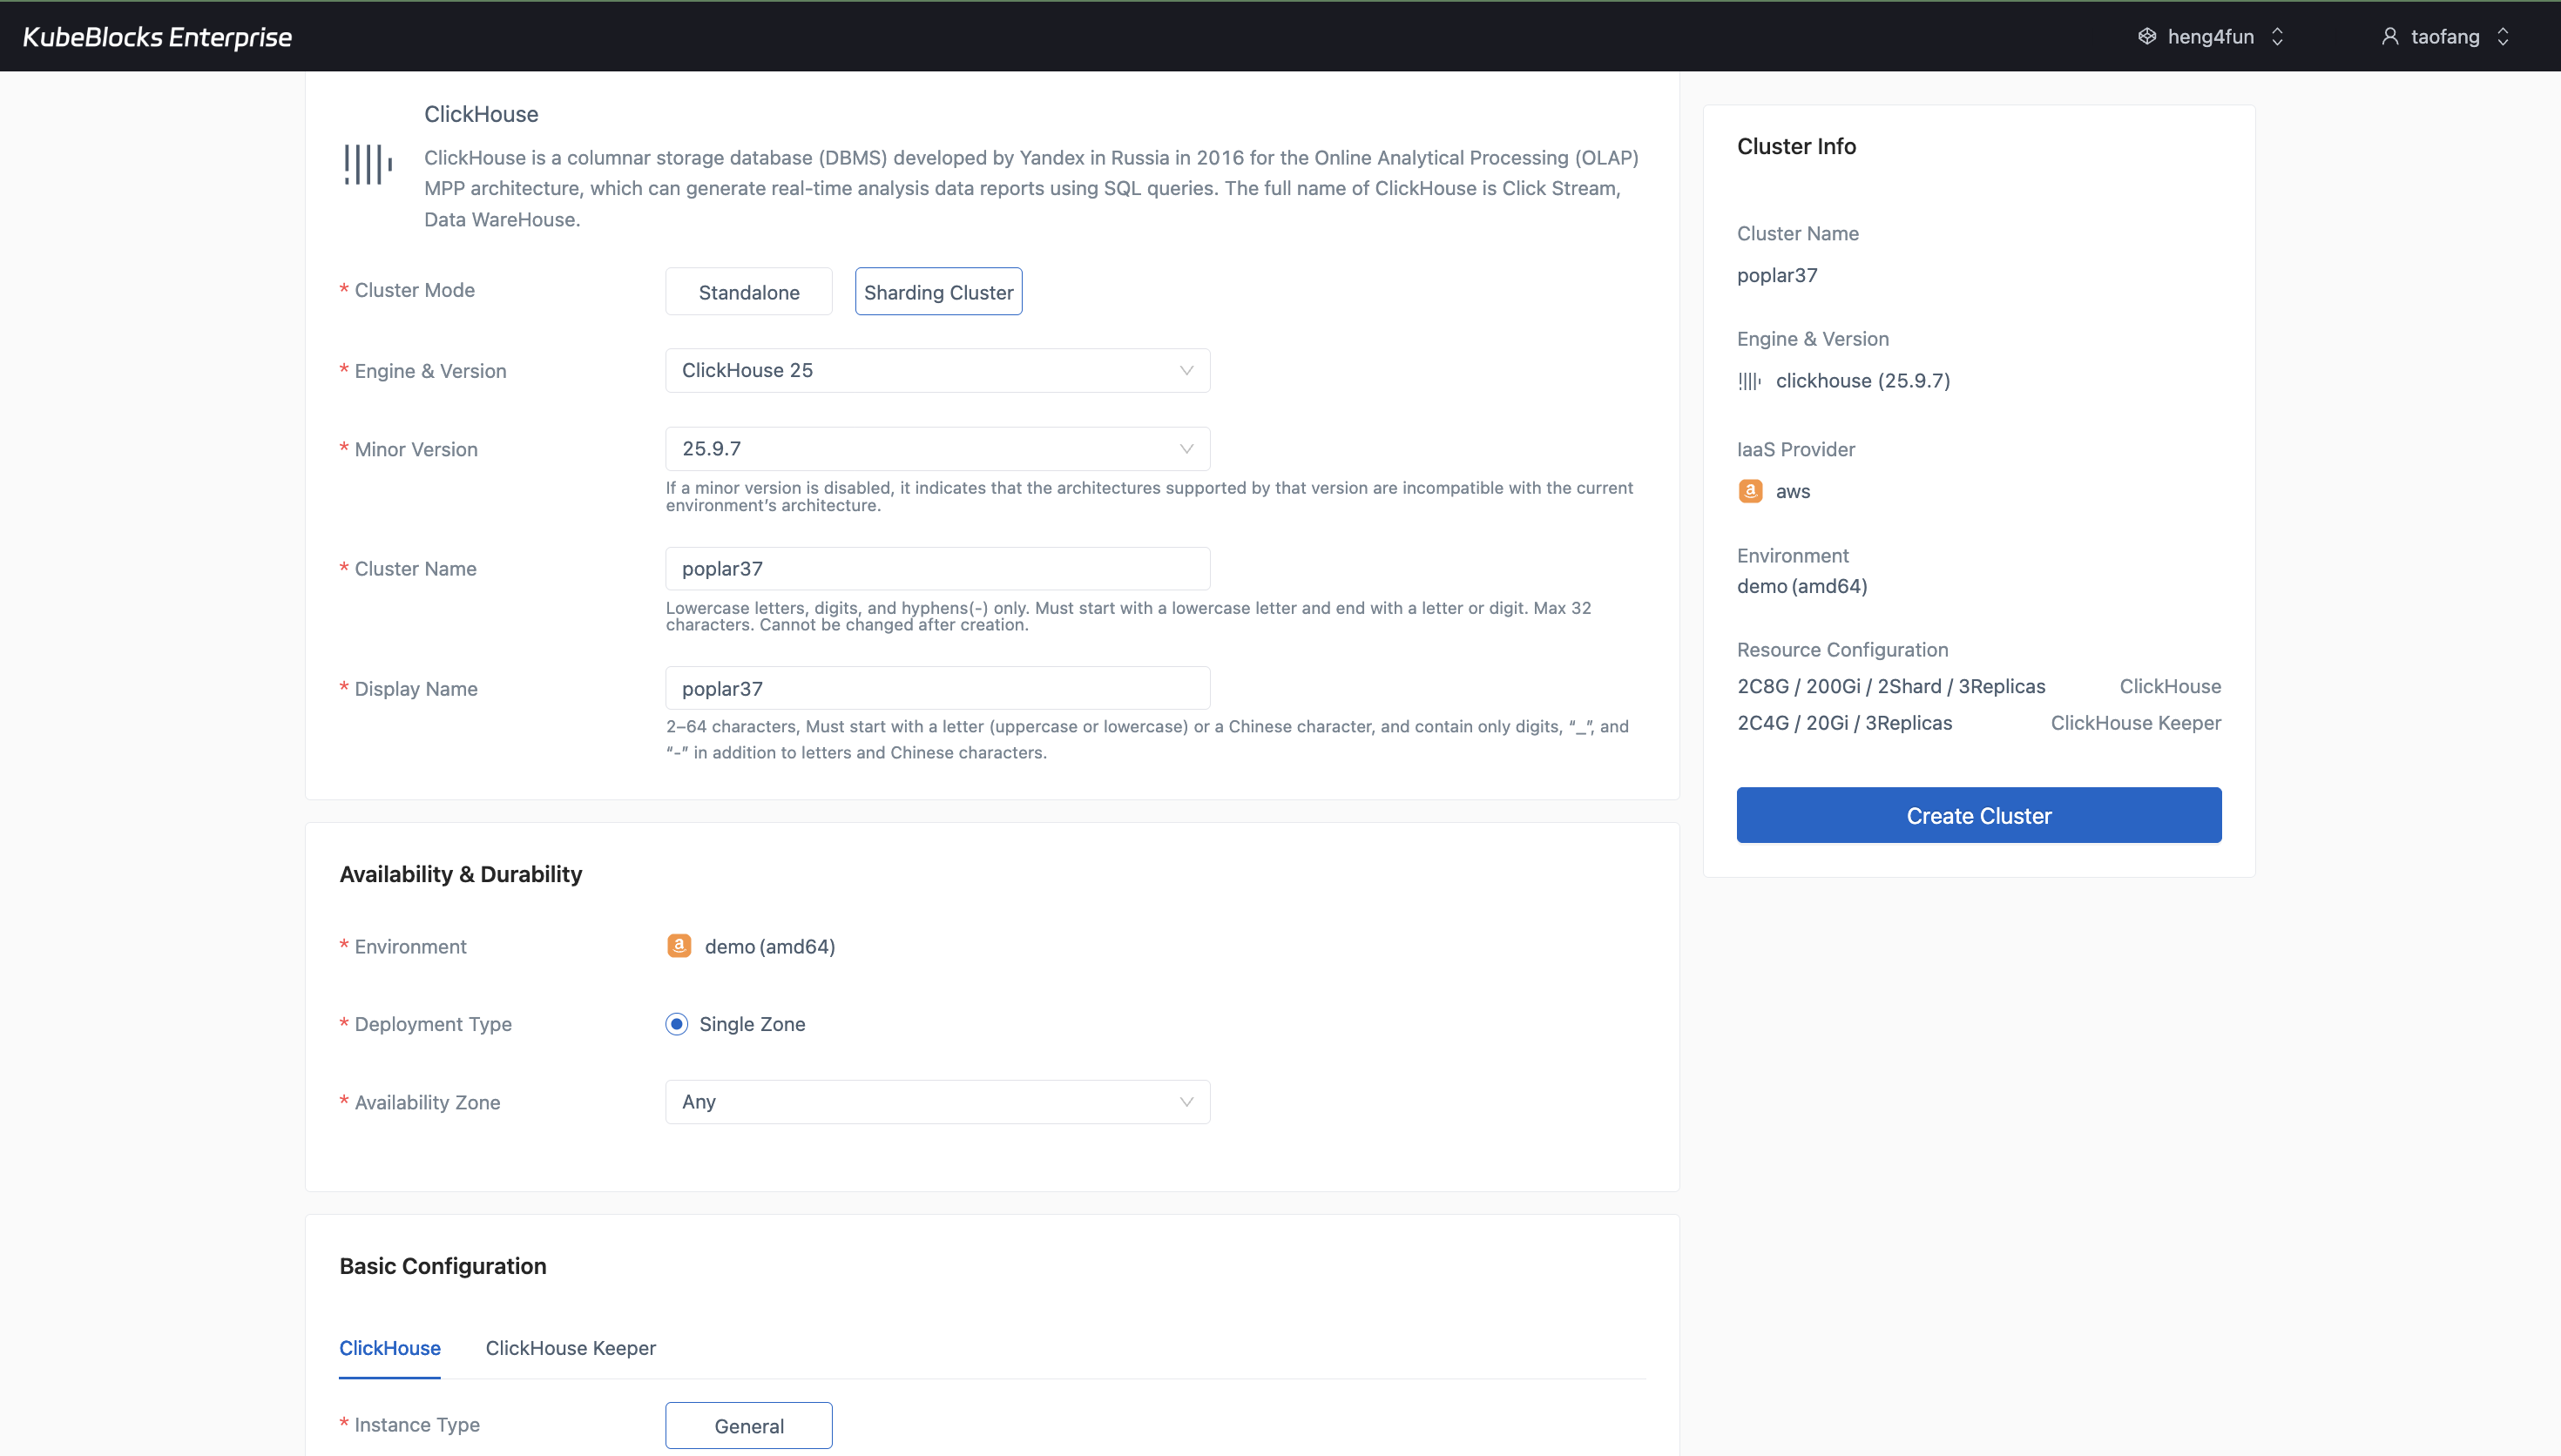
The create wizard exposes ClickHouse topology, version, environment, and resource choices before users create the cluster.
Create ClickHouse clusters with topology, version, and network choices
Launch ClickHouse from a guided wizard that keeps topology, version, environment, storage, backup, and network selections visible before users commit the cluster.
- Choose Standalone for compact workloads or Sharding Cluster when users need distributed analytical capacity.
- Select the ClickHouse version, minor version, environment, storage class, backup policy, and network mode in one flow.
- Review the generated cluster summary before creation so users can confirm the final topology and resource footprint.

Vertical Scaling presents CPU and memory choices before users submit the compute change.
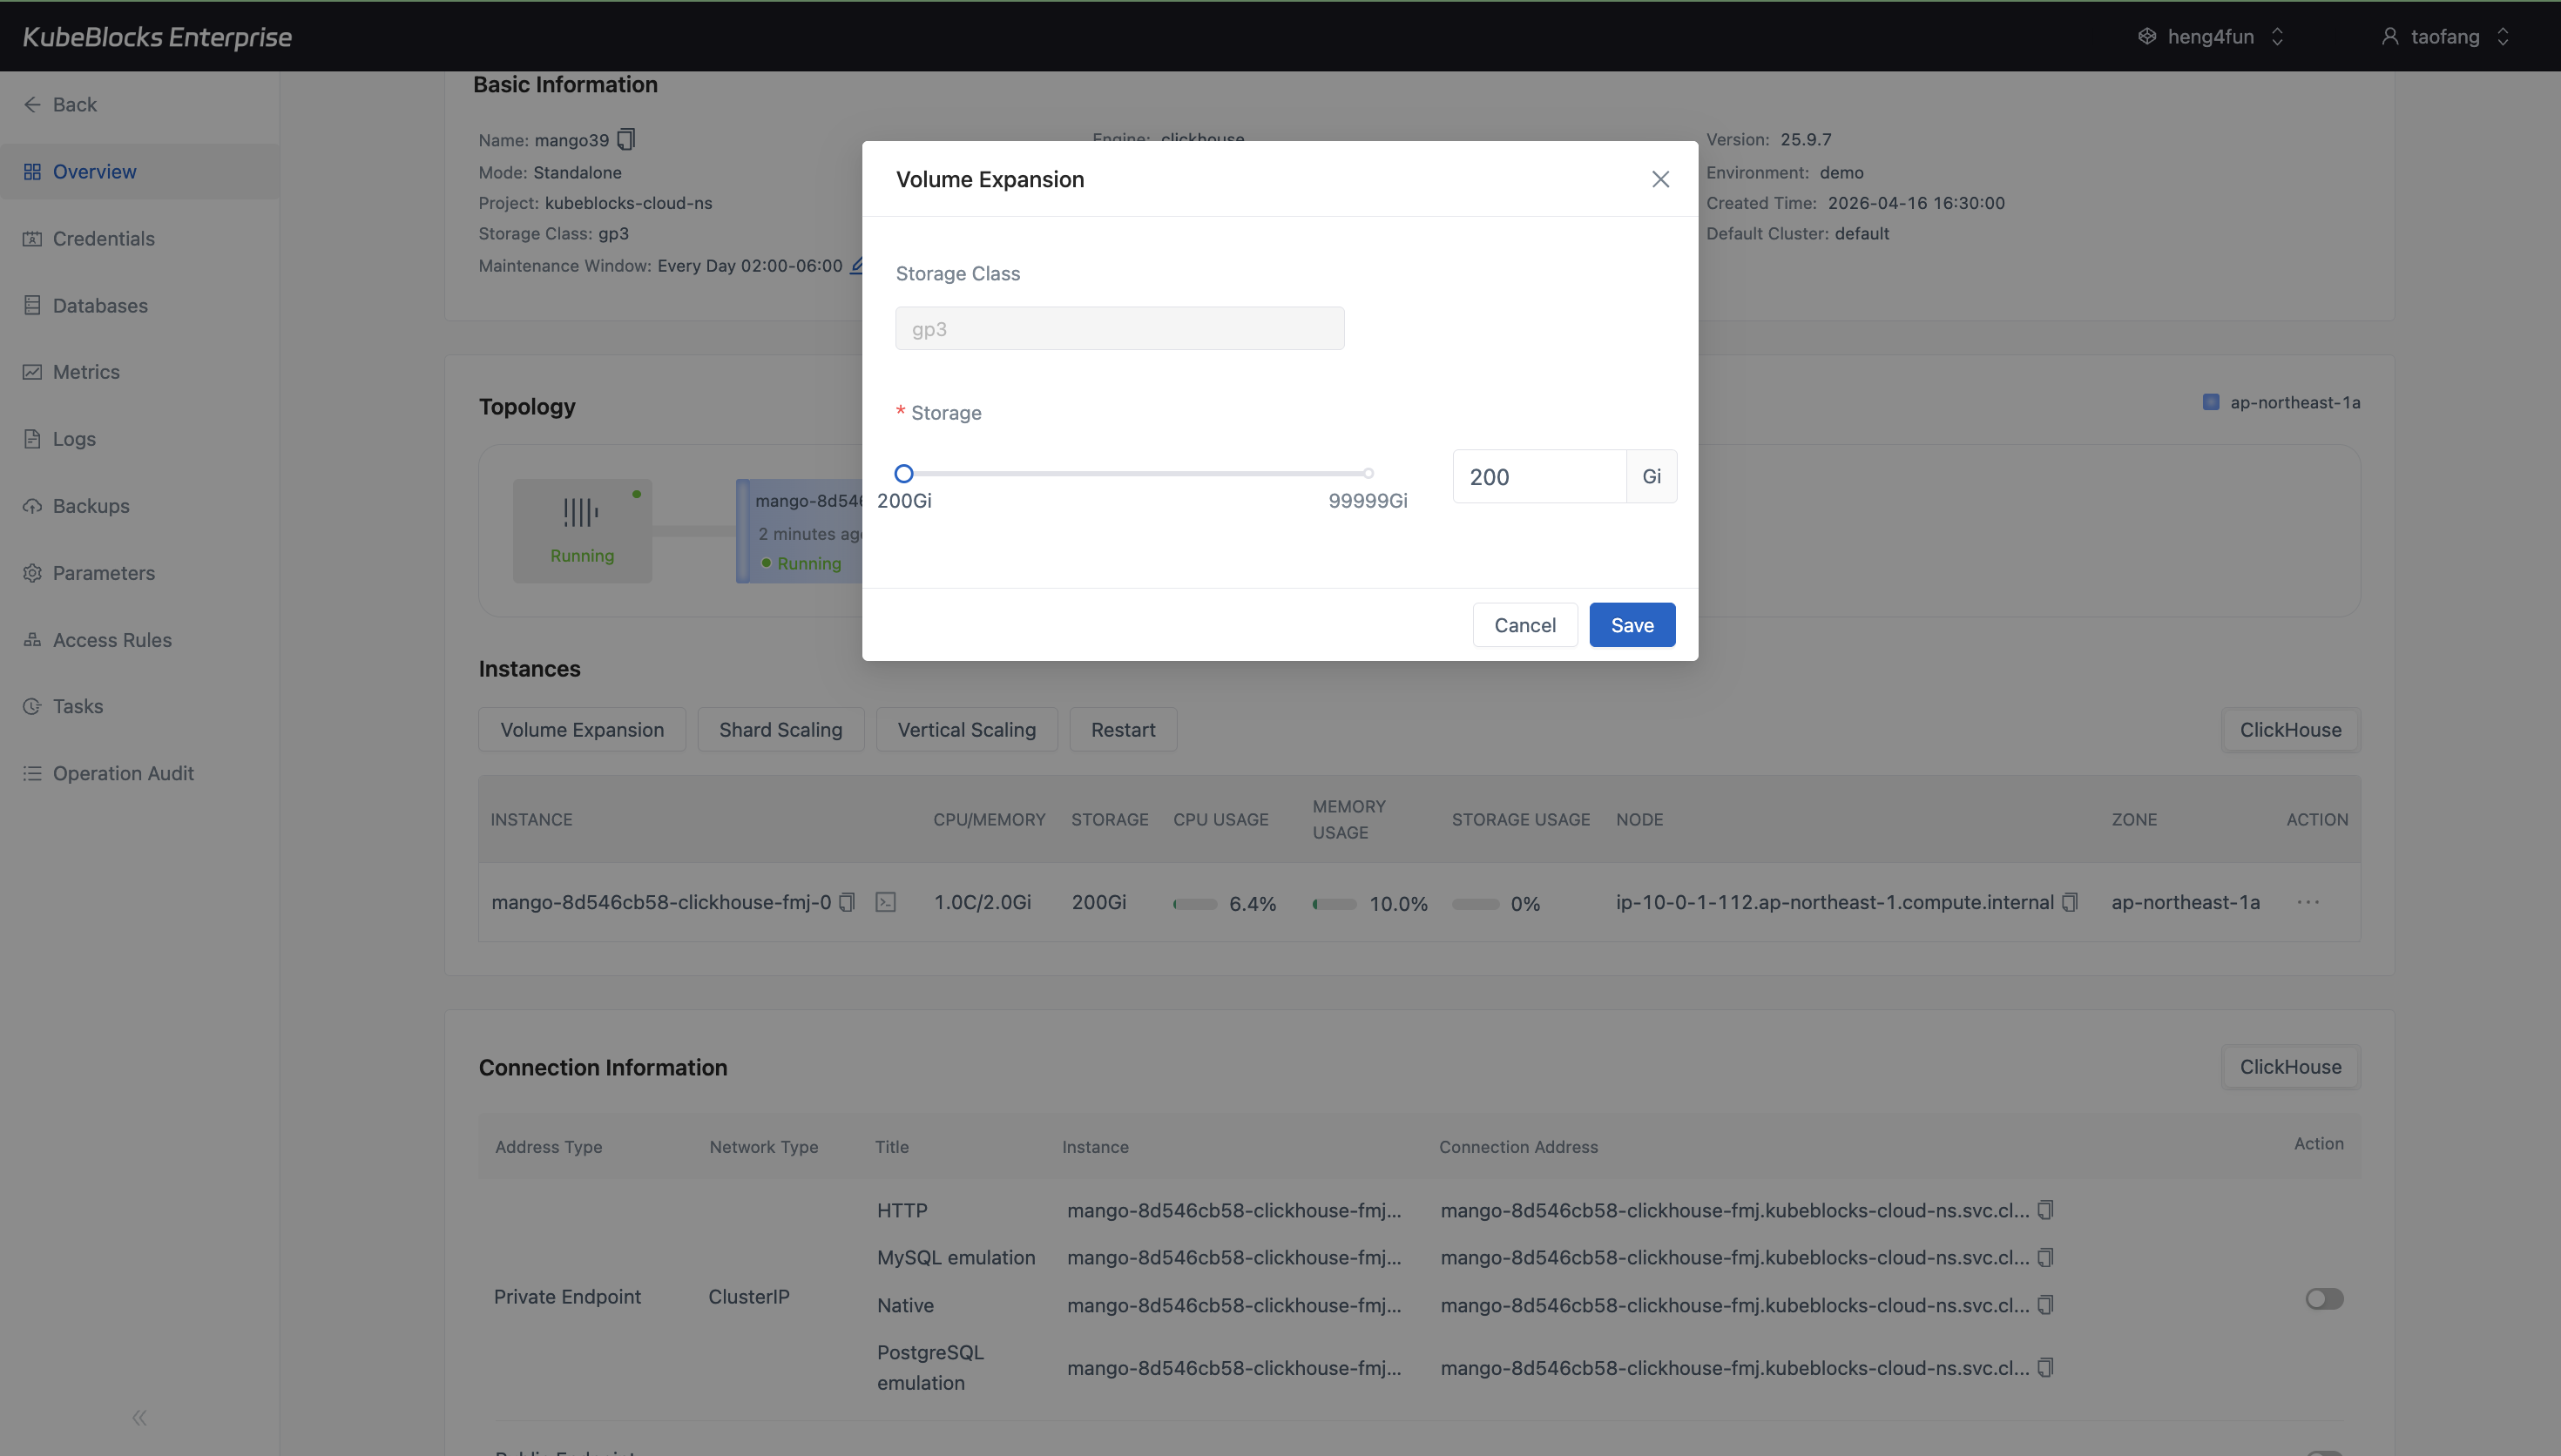
Volume Expansion keeps storage growth explicit with current capacity, maximum capacity, and a new-size input.
Grow compute and storage from guided option dialogs
Adjust ClickHouse capacity from the overview without turning scaling into a manual infrastructure change. Users can review CPU, memory, storage, and execution timing before submitting a task.
- Use Vertical Scaling to choose a larger CPU and memory profile such as `2C8G`, `4C16G`, or `8C32G`.
- Use Volume Expansion to increase persistent storage from the current capacity up to the supported upper bound.
- Select Immediate, Scheduled, or Maintenance Window execution for compute changes when the dialog exposes timing controls.
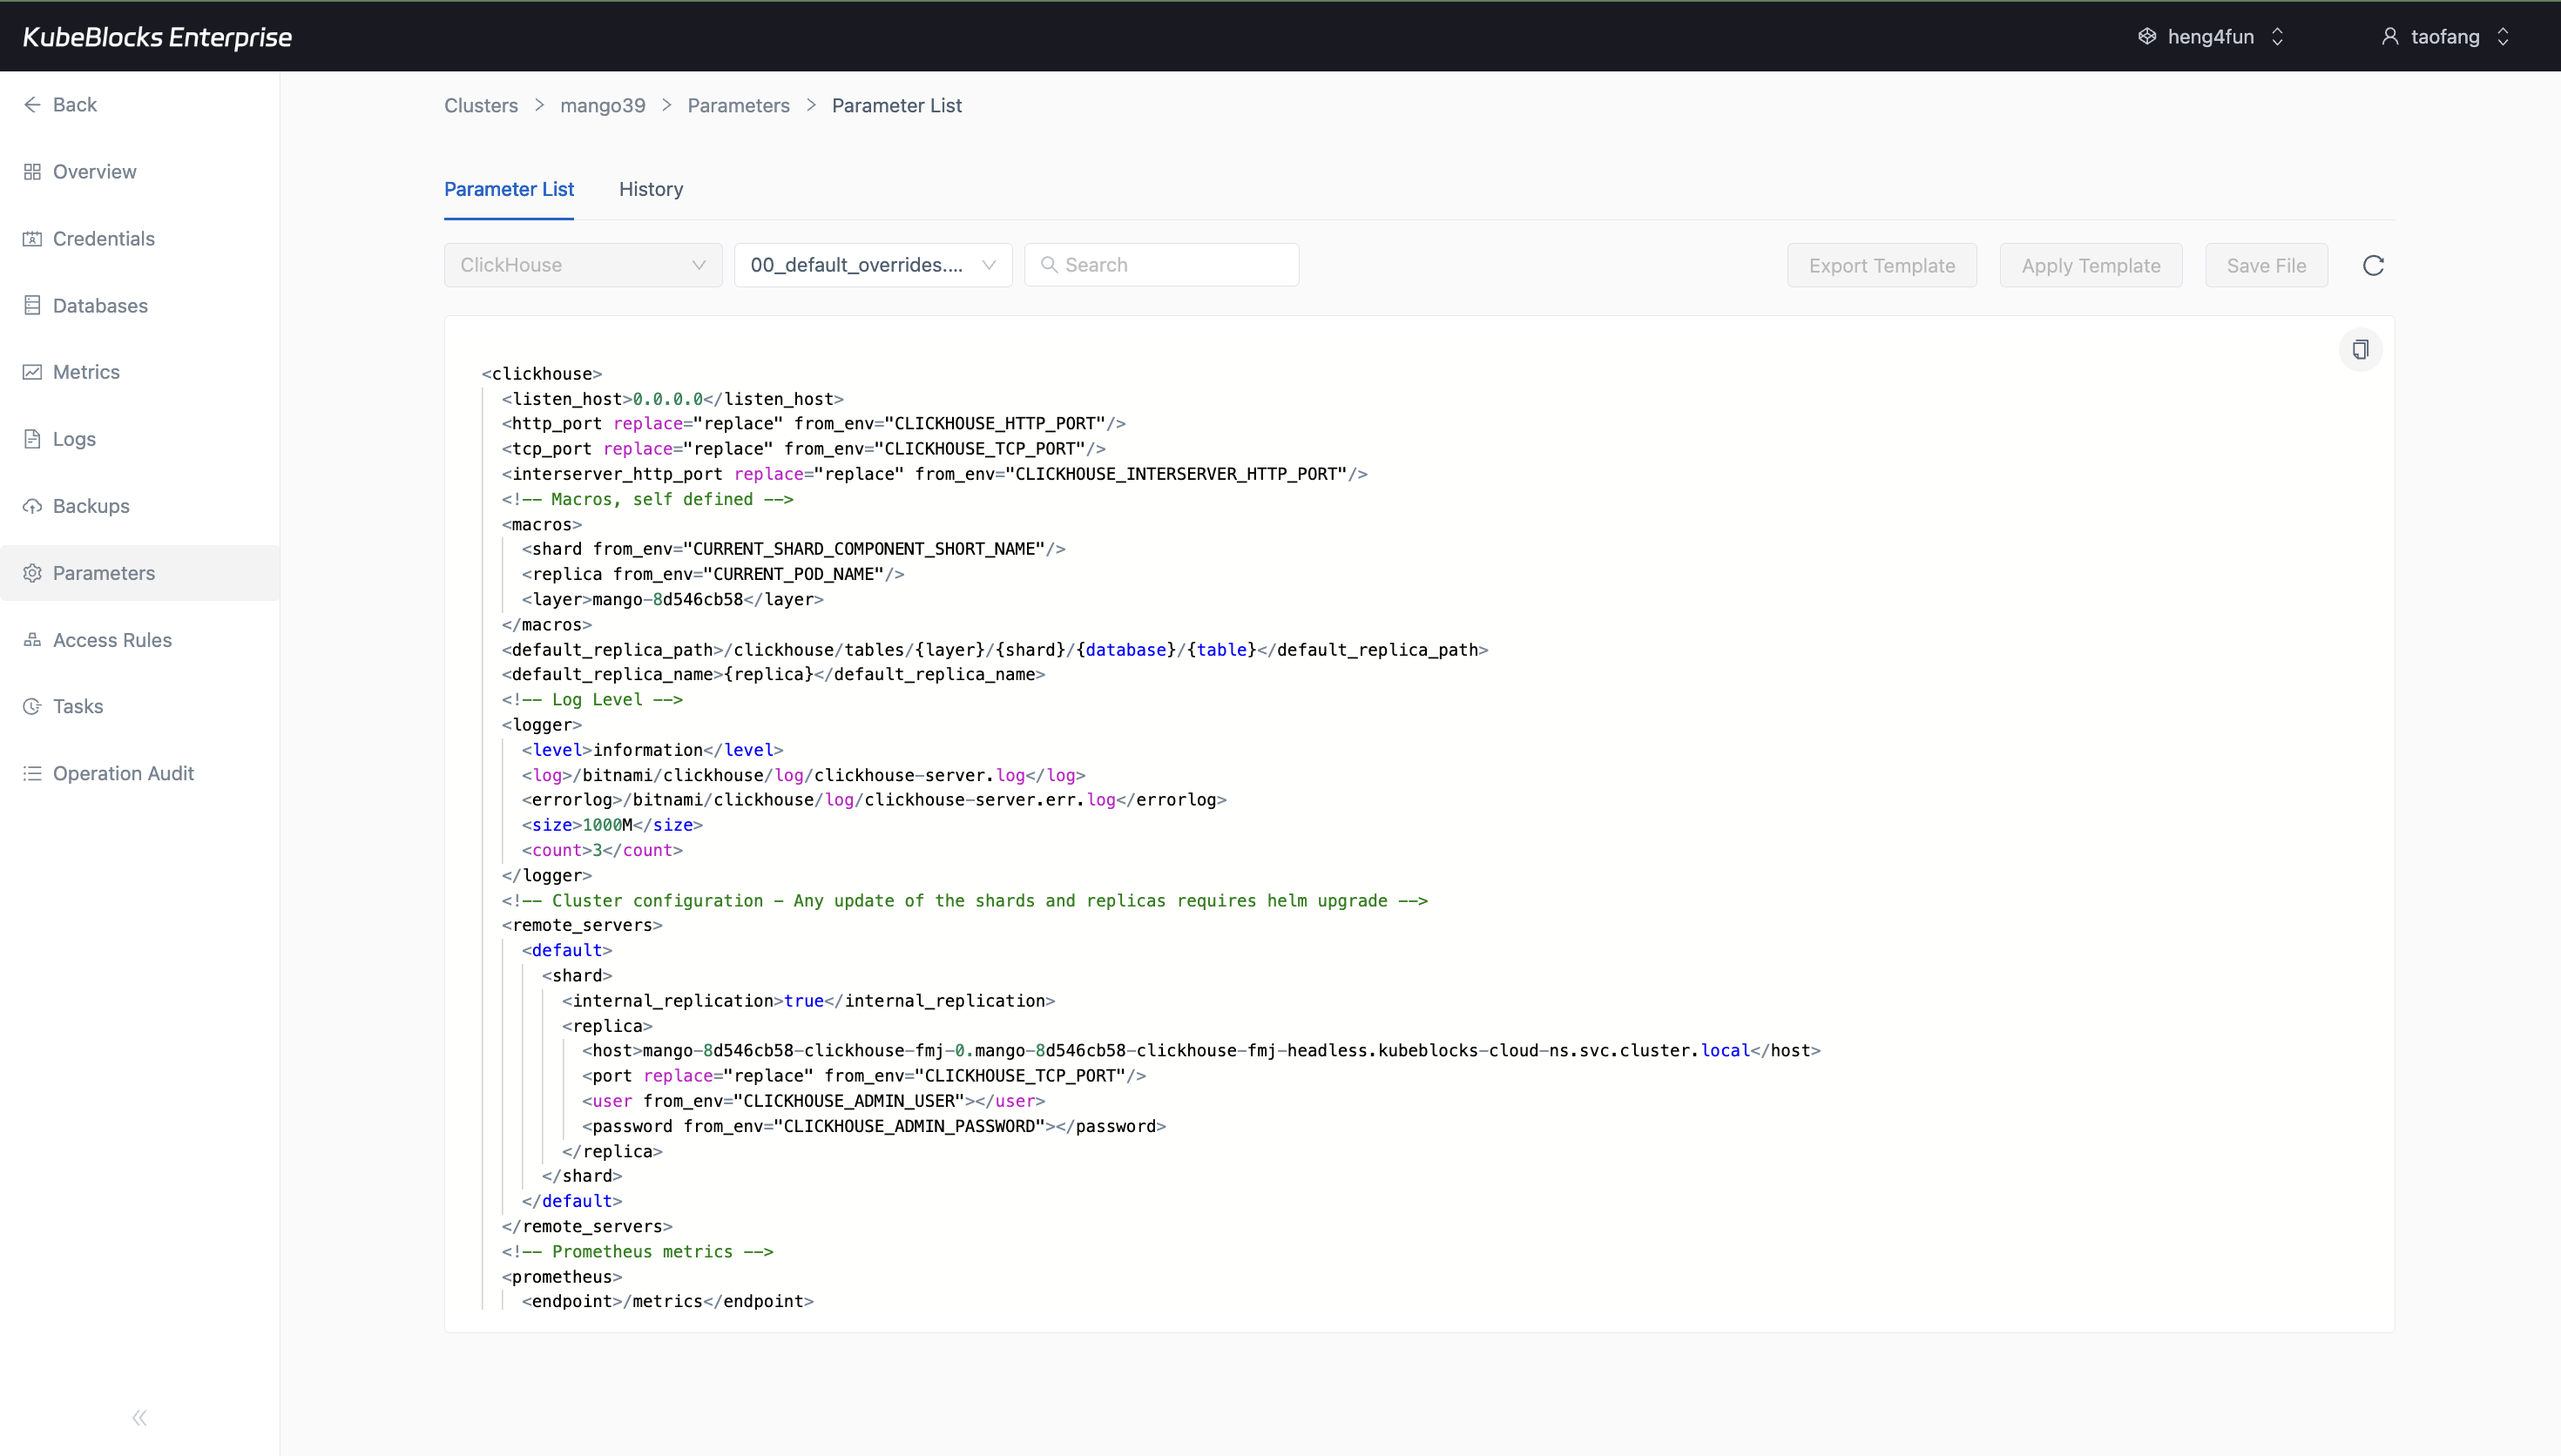
The Parameters workspace exposes ClickHouse tuning through a real XML configuration editor and template controls.
Tune ClickHouse through the Parameters workspace
Manage ClickHouse configuration from the Parameters page. In the tested console, ClickHouse exposes a file-based XML editor rather than the table-style parameter list used by some other engines.
- Open `00_default_overrides.xml` to review listener, log, replica, remote server, and Prometheus metric settings.
- Use search, export template, apply template, and save controls from the same tuning workspace.
- Keep ClickHouse configuration review separate from lifecycle, scaling, backup, and monitoring work.
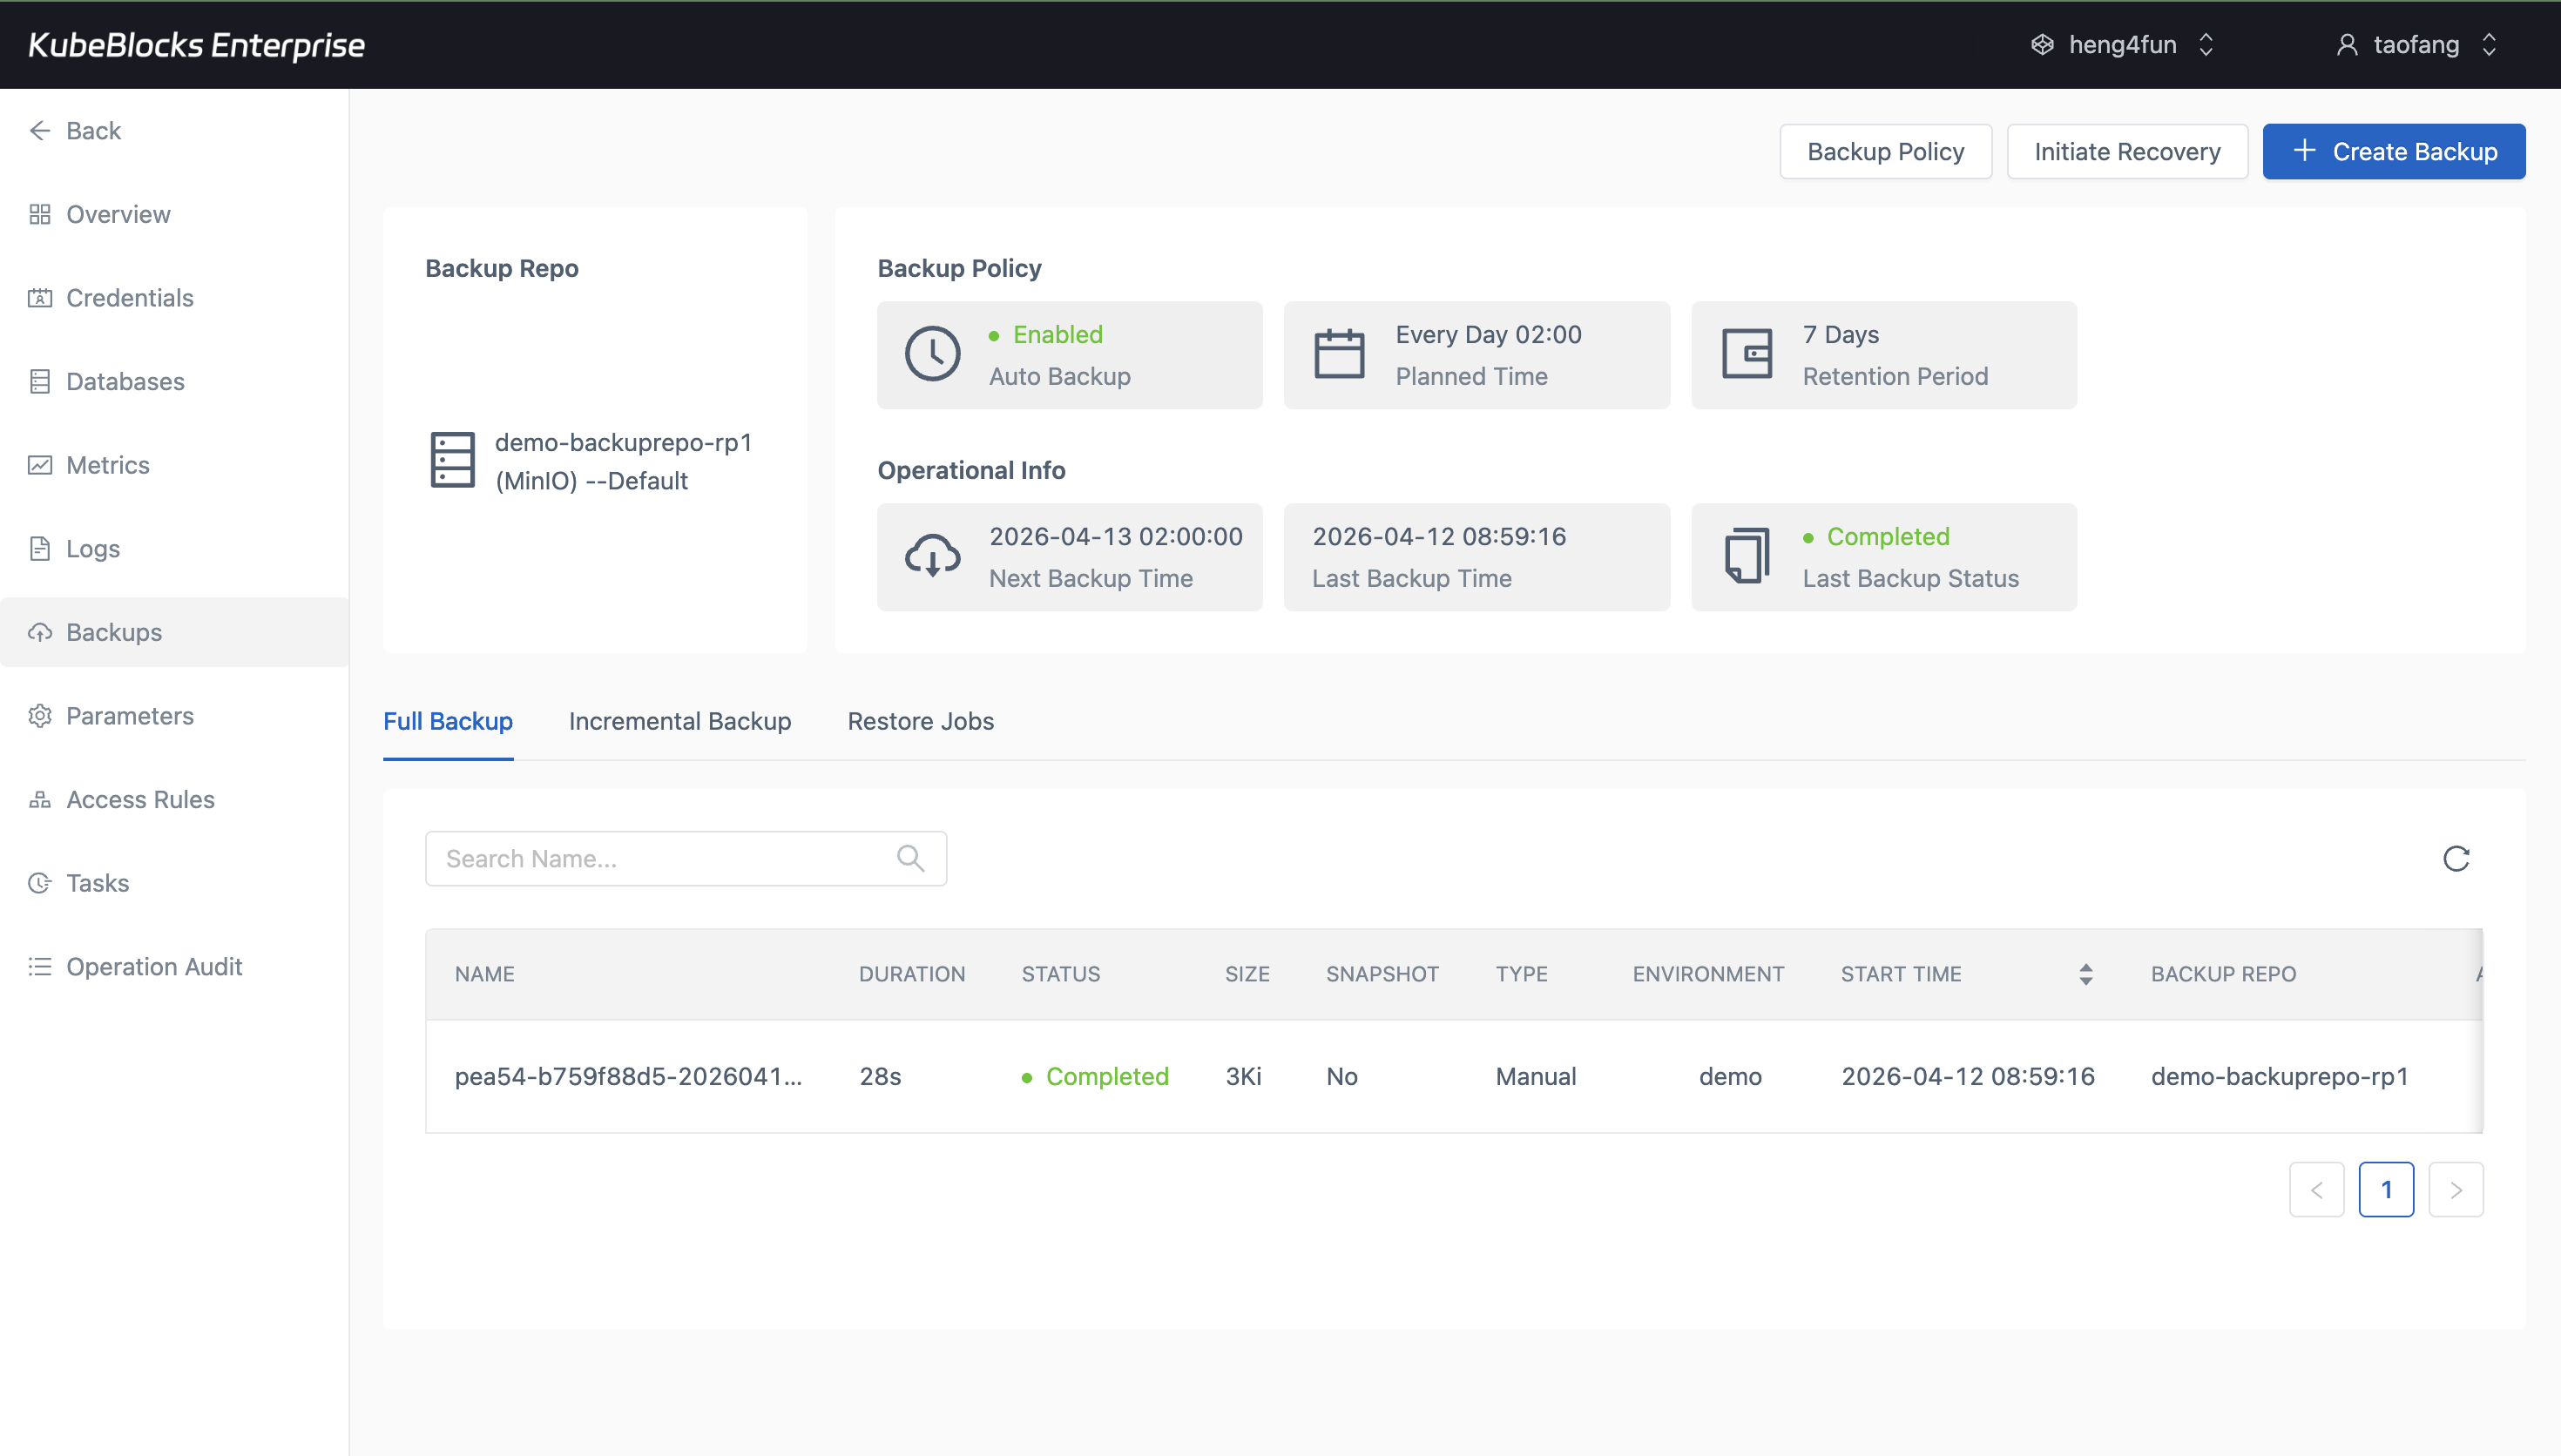
Backup history helps users confirm real ClickHouse protection points before risky changes or recovery drills.
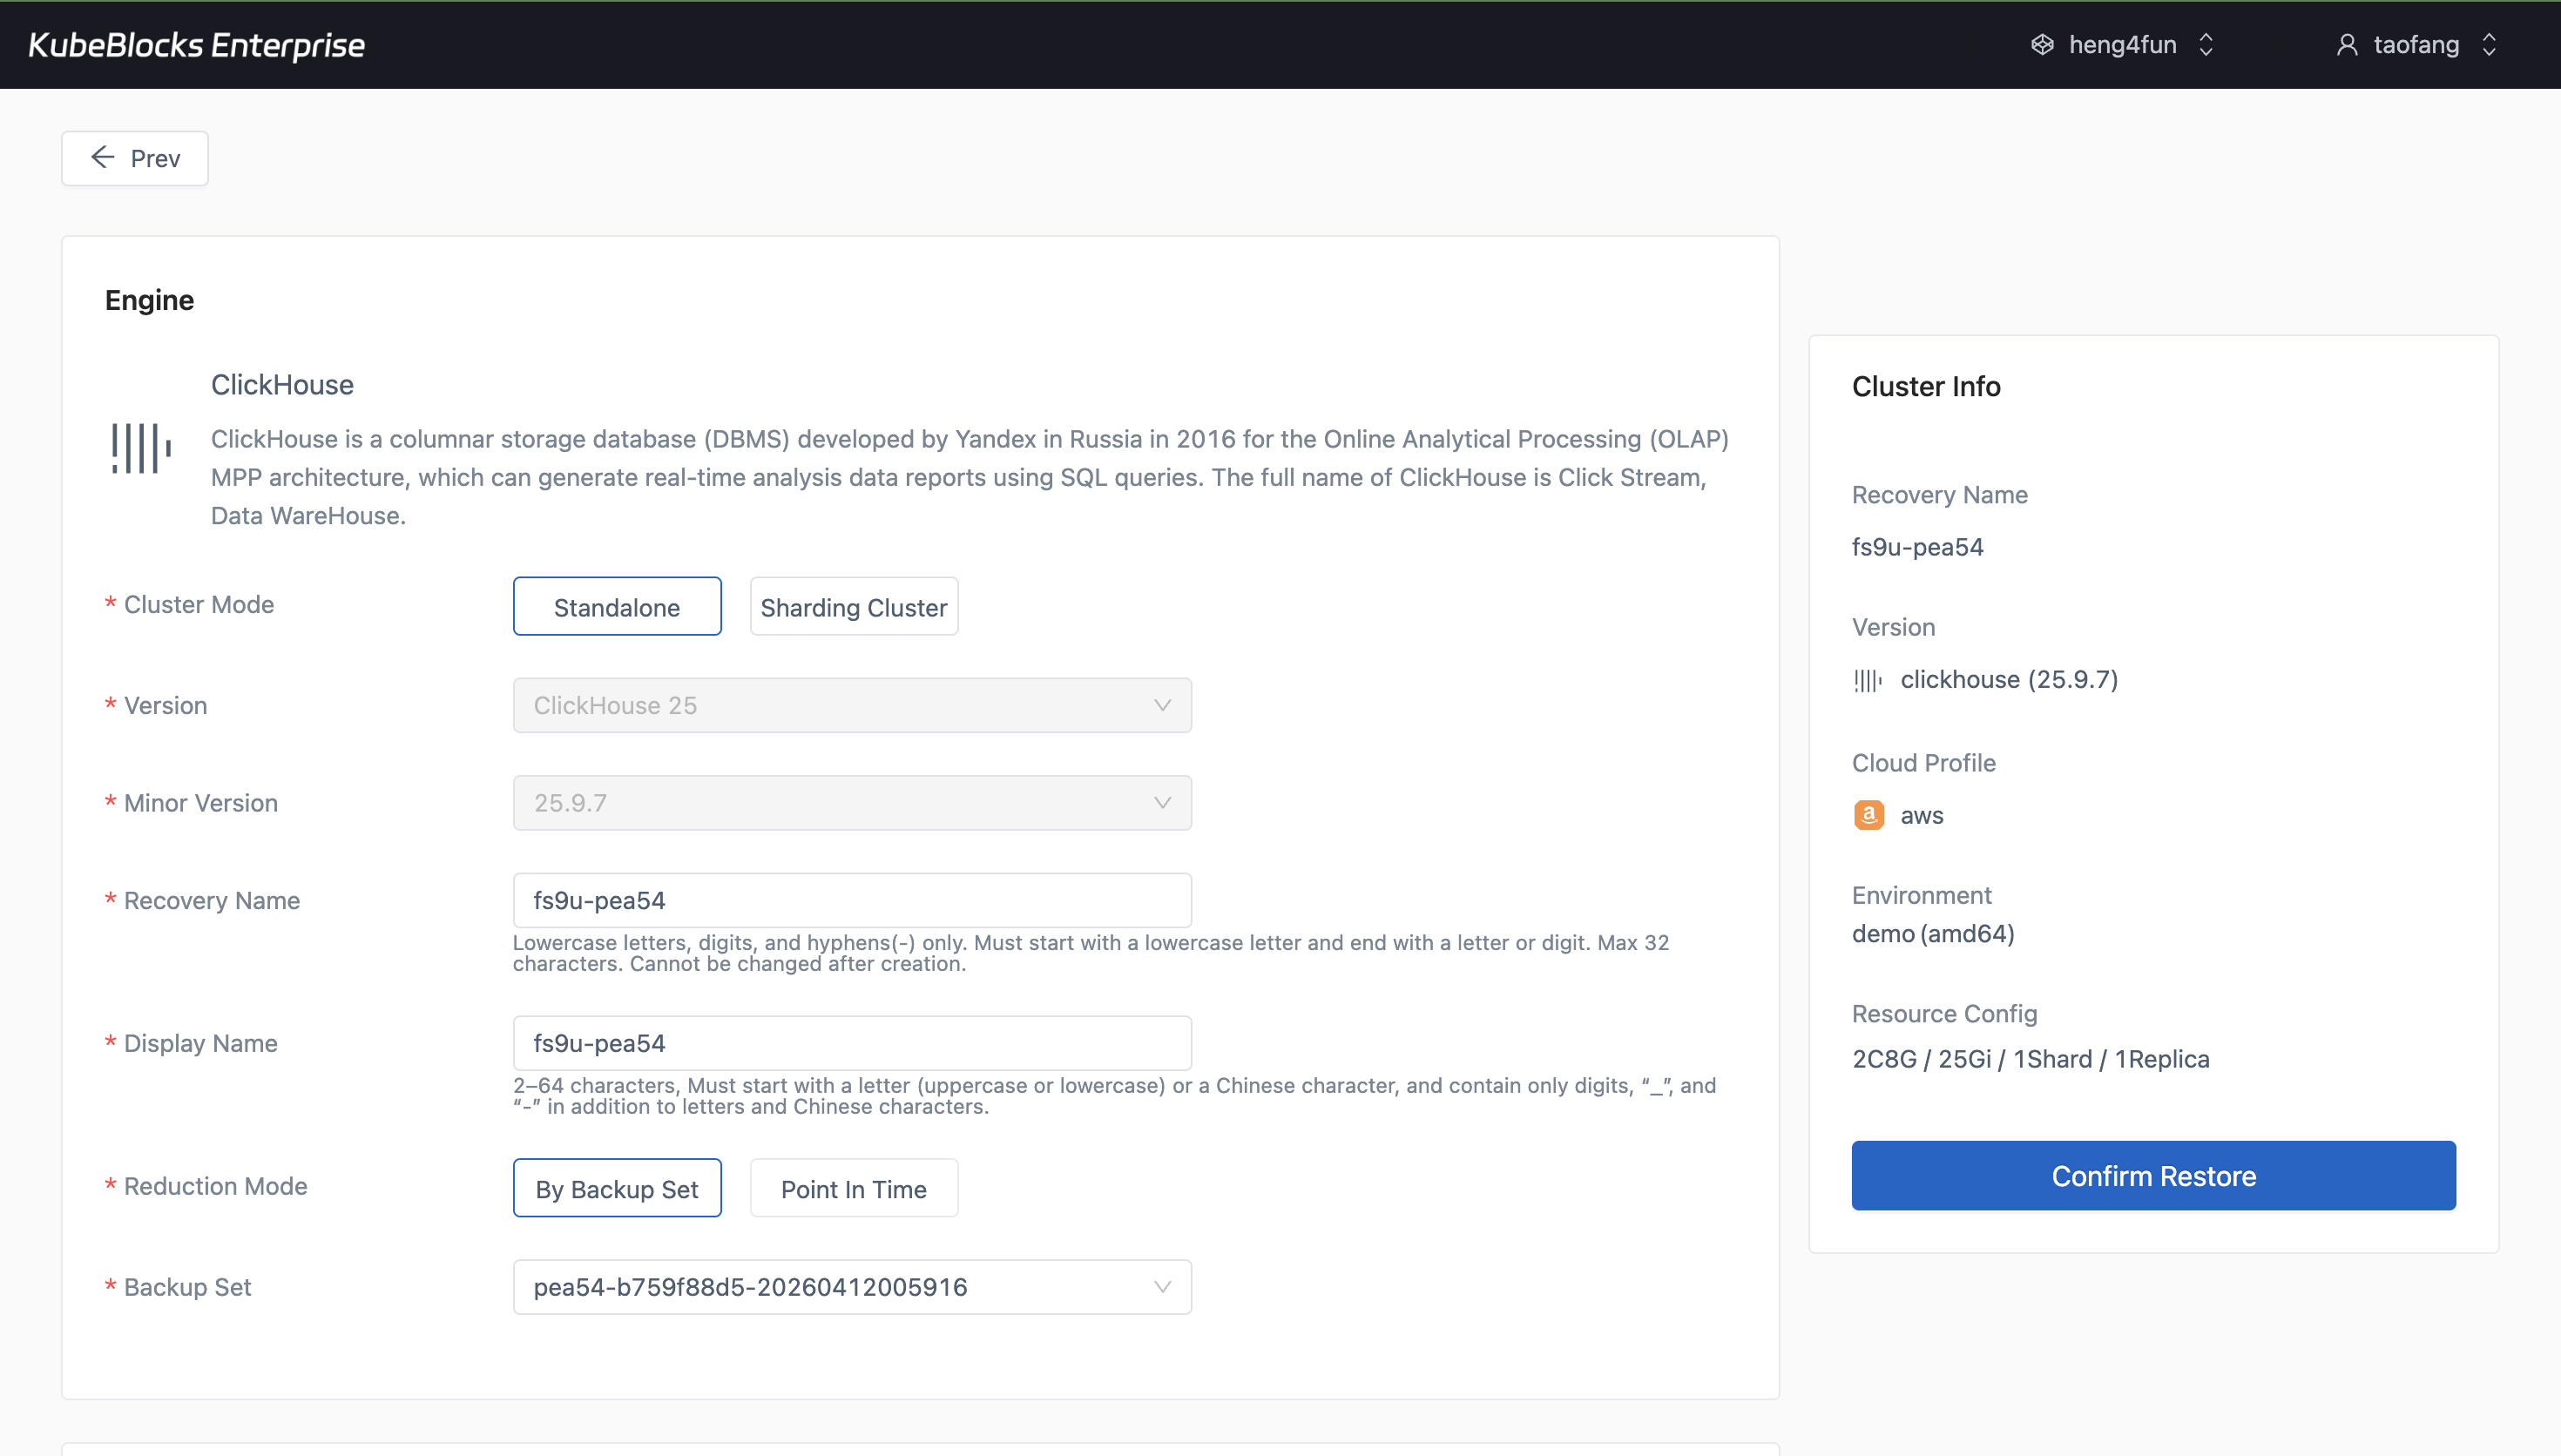
The restore wizard turns an existing ClickHouse backup into a guided recovery path for validation and recovery planning.
Protect analytical data with backup and restore workflows
Create full backups from the Backups page and open a recovery flow from a real backup set whenever users need validation or recovery options.
- Review completed full backups with repository, size, and duration visible in context.
- Open Restore directly from an existing backup record instead of piecing together recovery inputs manually.
- Keep data protection separate from routine lifecycle, scaling, and tuning changes.
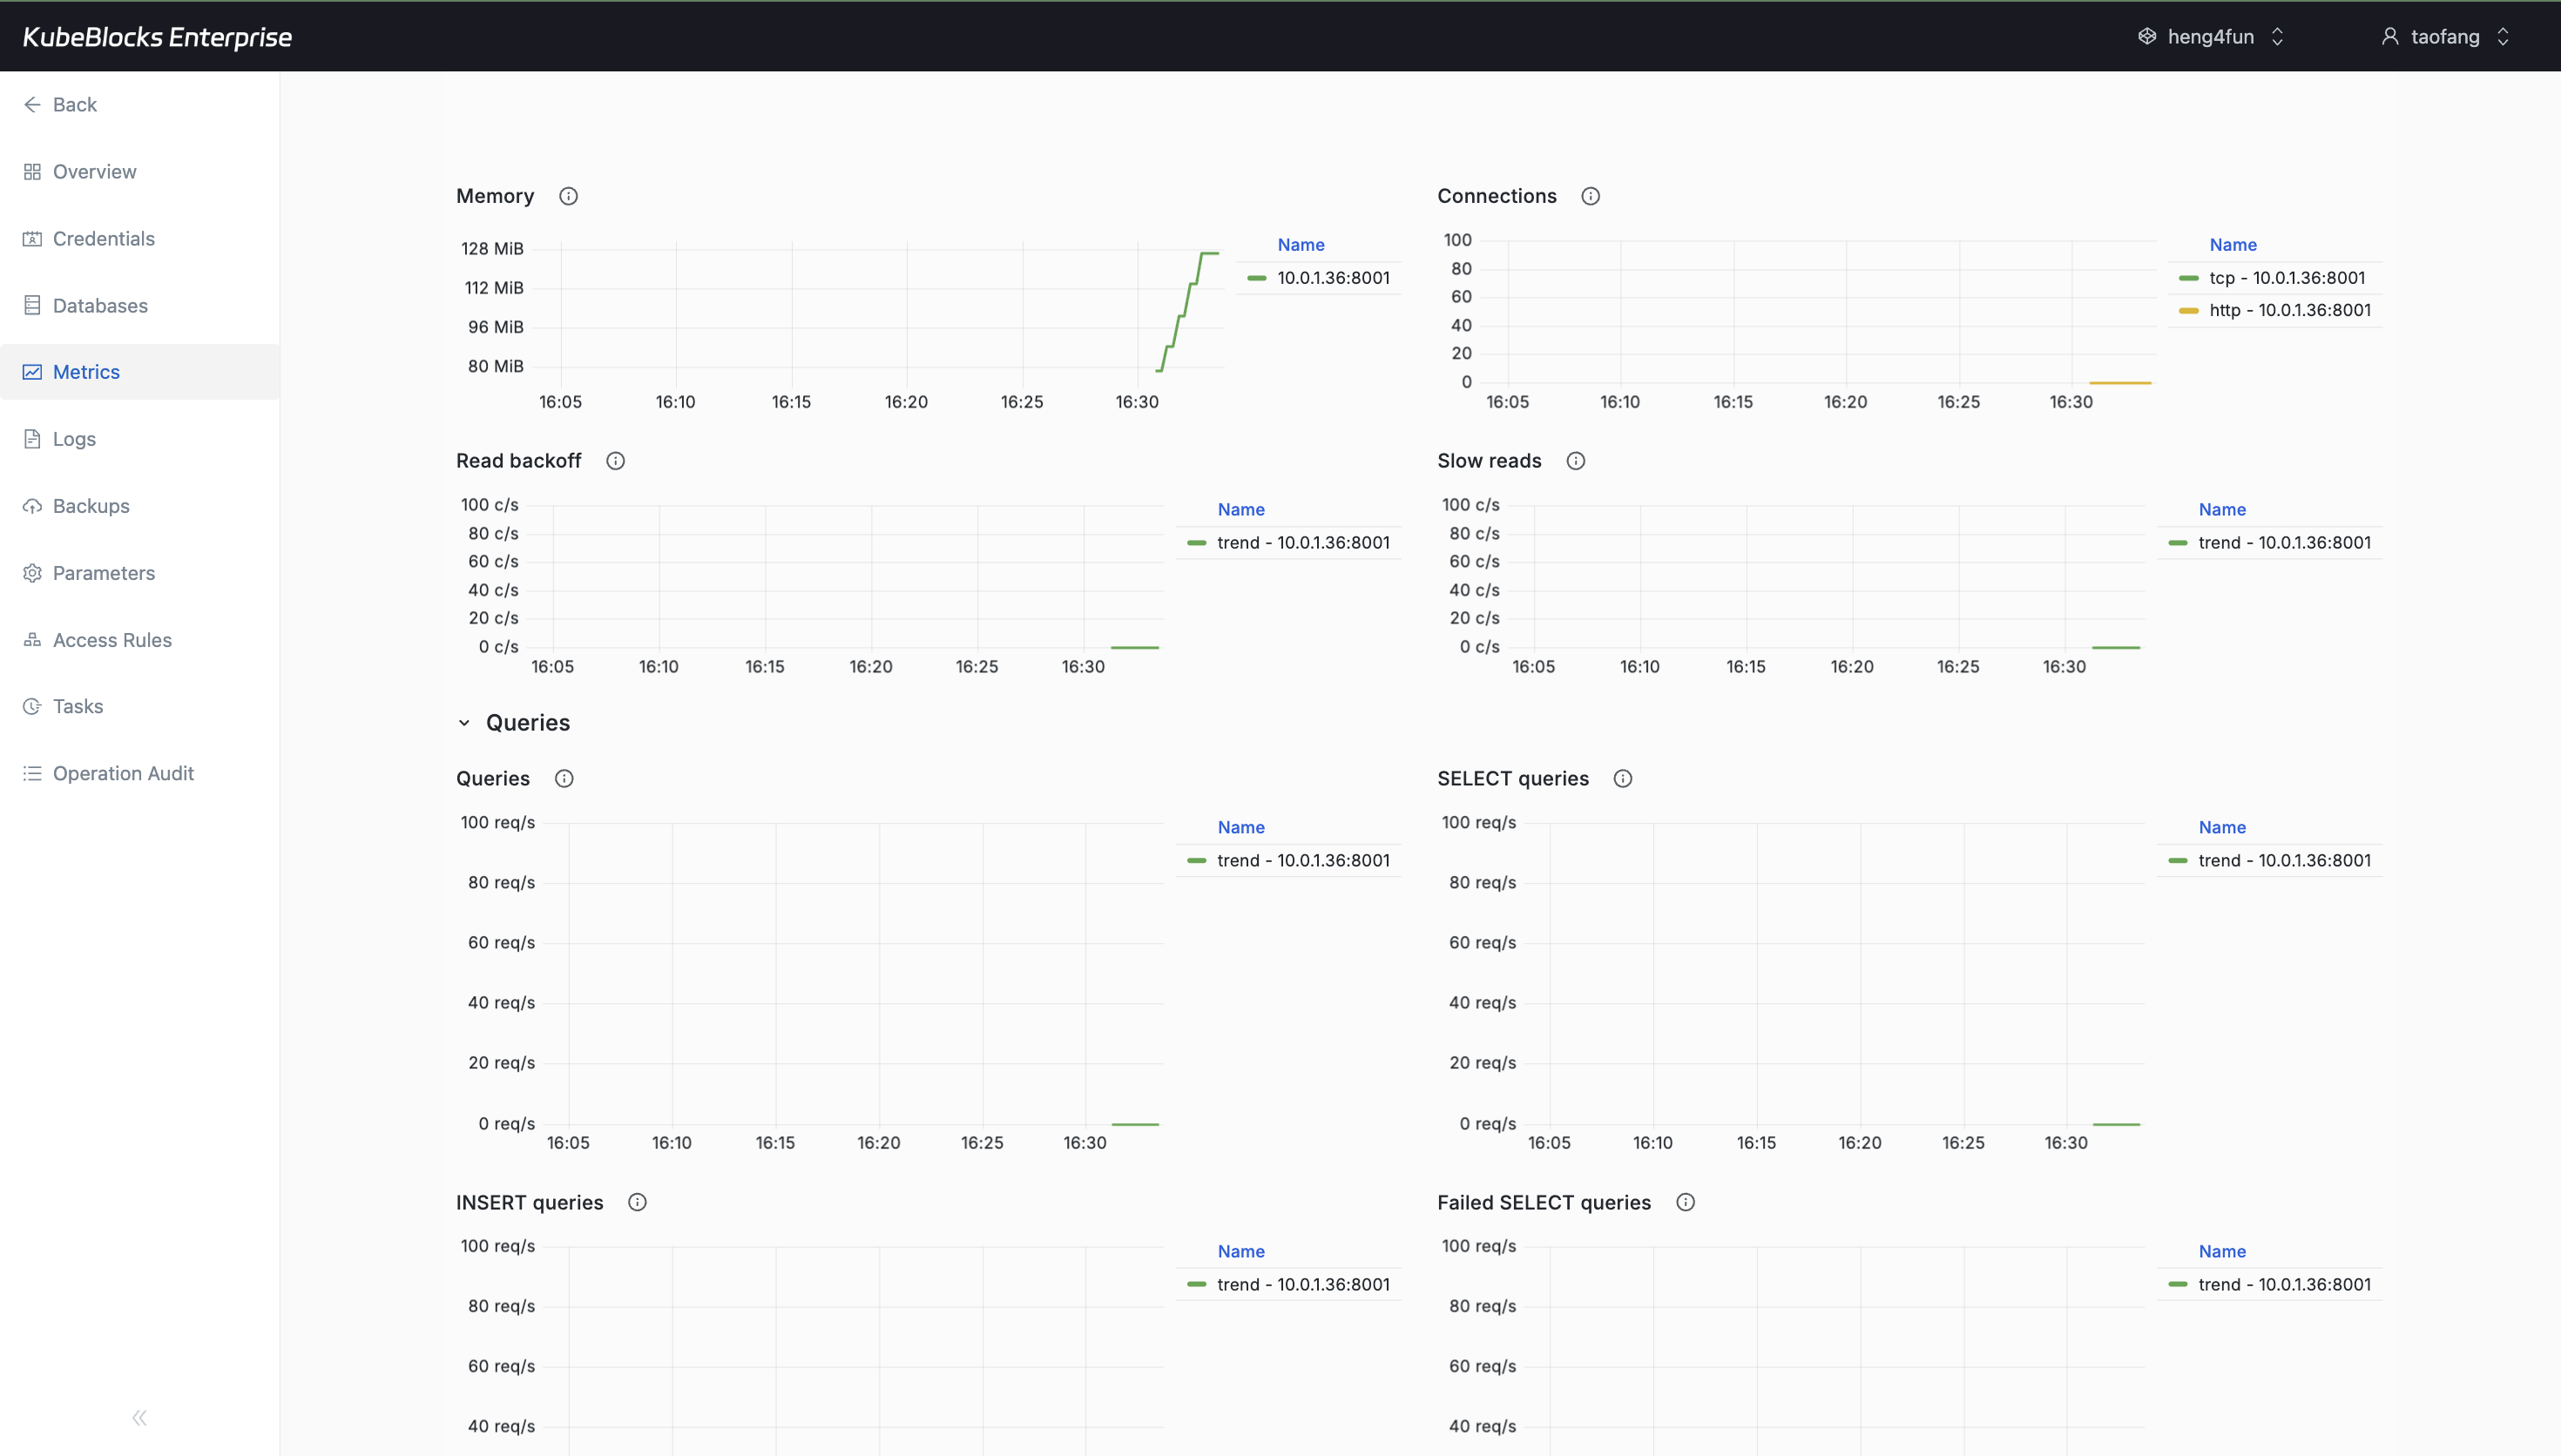
Cluster Monitor shows multiple ClickHouse runtime charts after hydration, including memory, connection, and query panels.
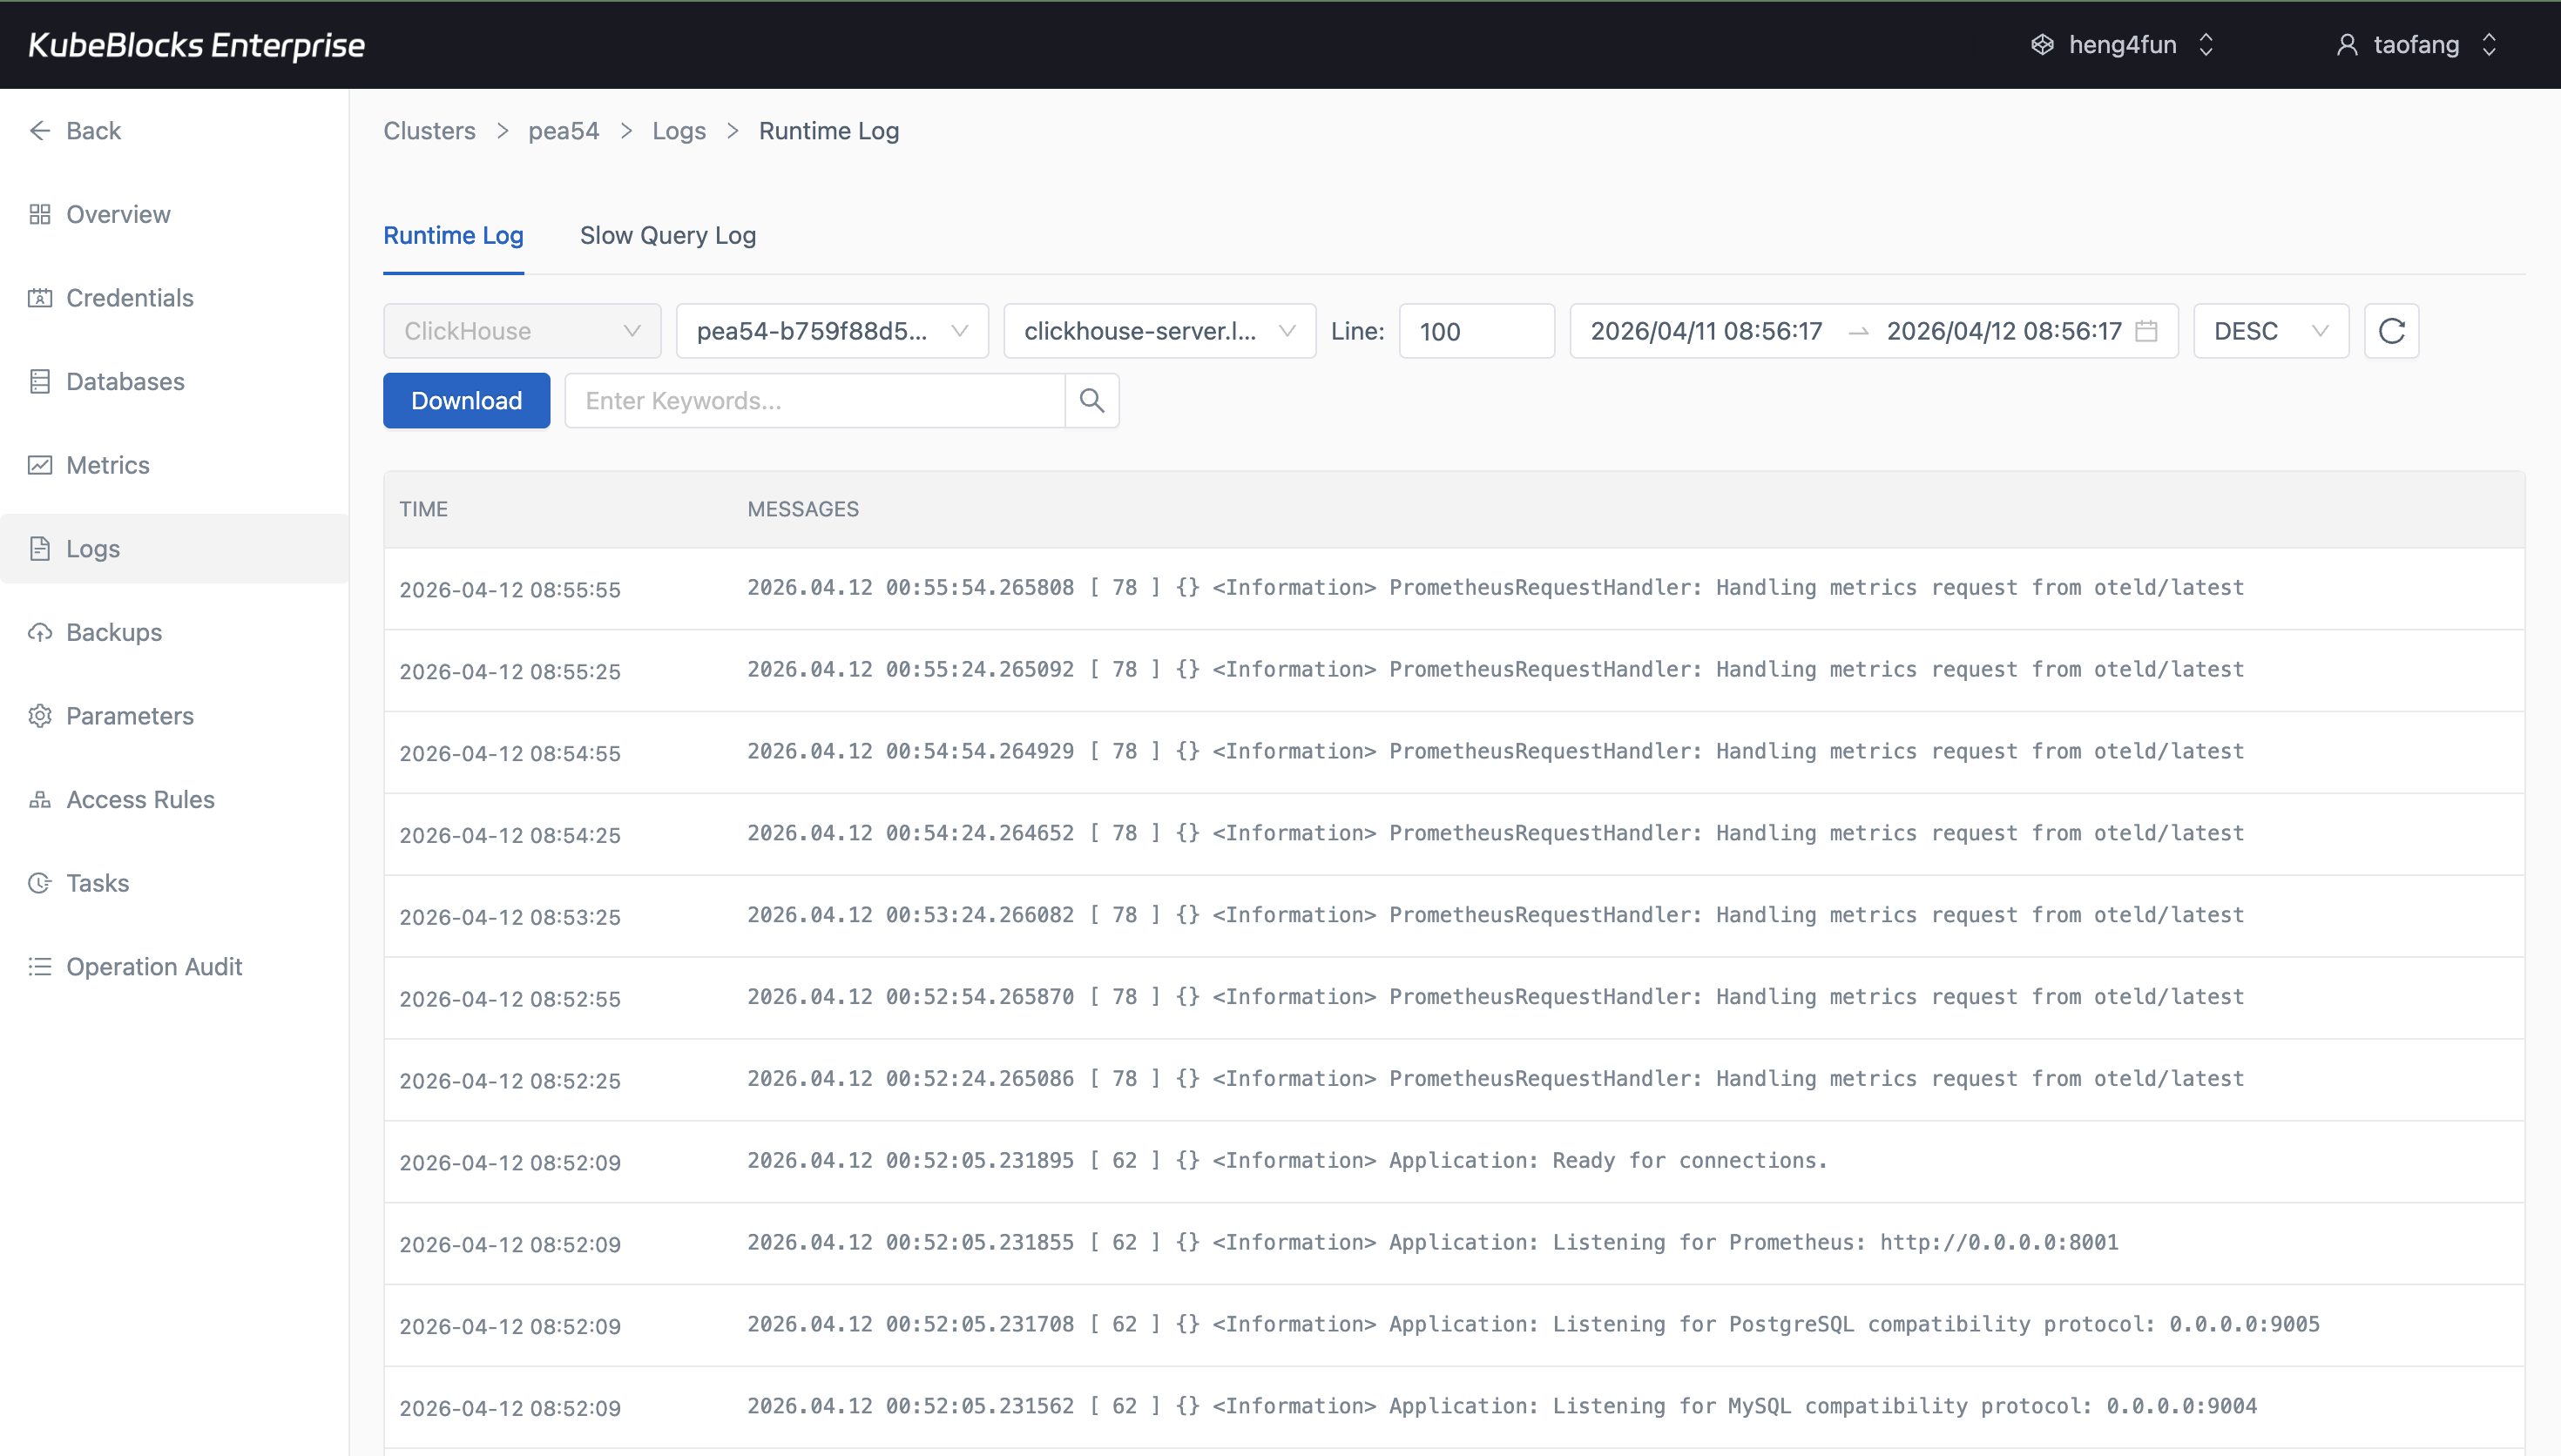
Runtime Log captures real ClickHouse startup and service activity for faster troubleshooting and validation.
Track ClickHouse health with deeper metrics and runtime logs
Watch ClickHouse behavior from Cluster Monitor and pivot into Runtime Log when users need to validate startup, resource usage, connections, and query-serving behavior.
- Monitor memory, connections, read backoff, slow reads, query volume, and failed query charts after the panels load.
- Inspect real startup and service log lines from Runtime Log without leaving the cluster workspace.
- Keep runtime visibility separate from task history, backup, and access-control workflows.
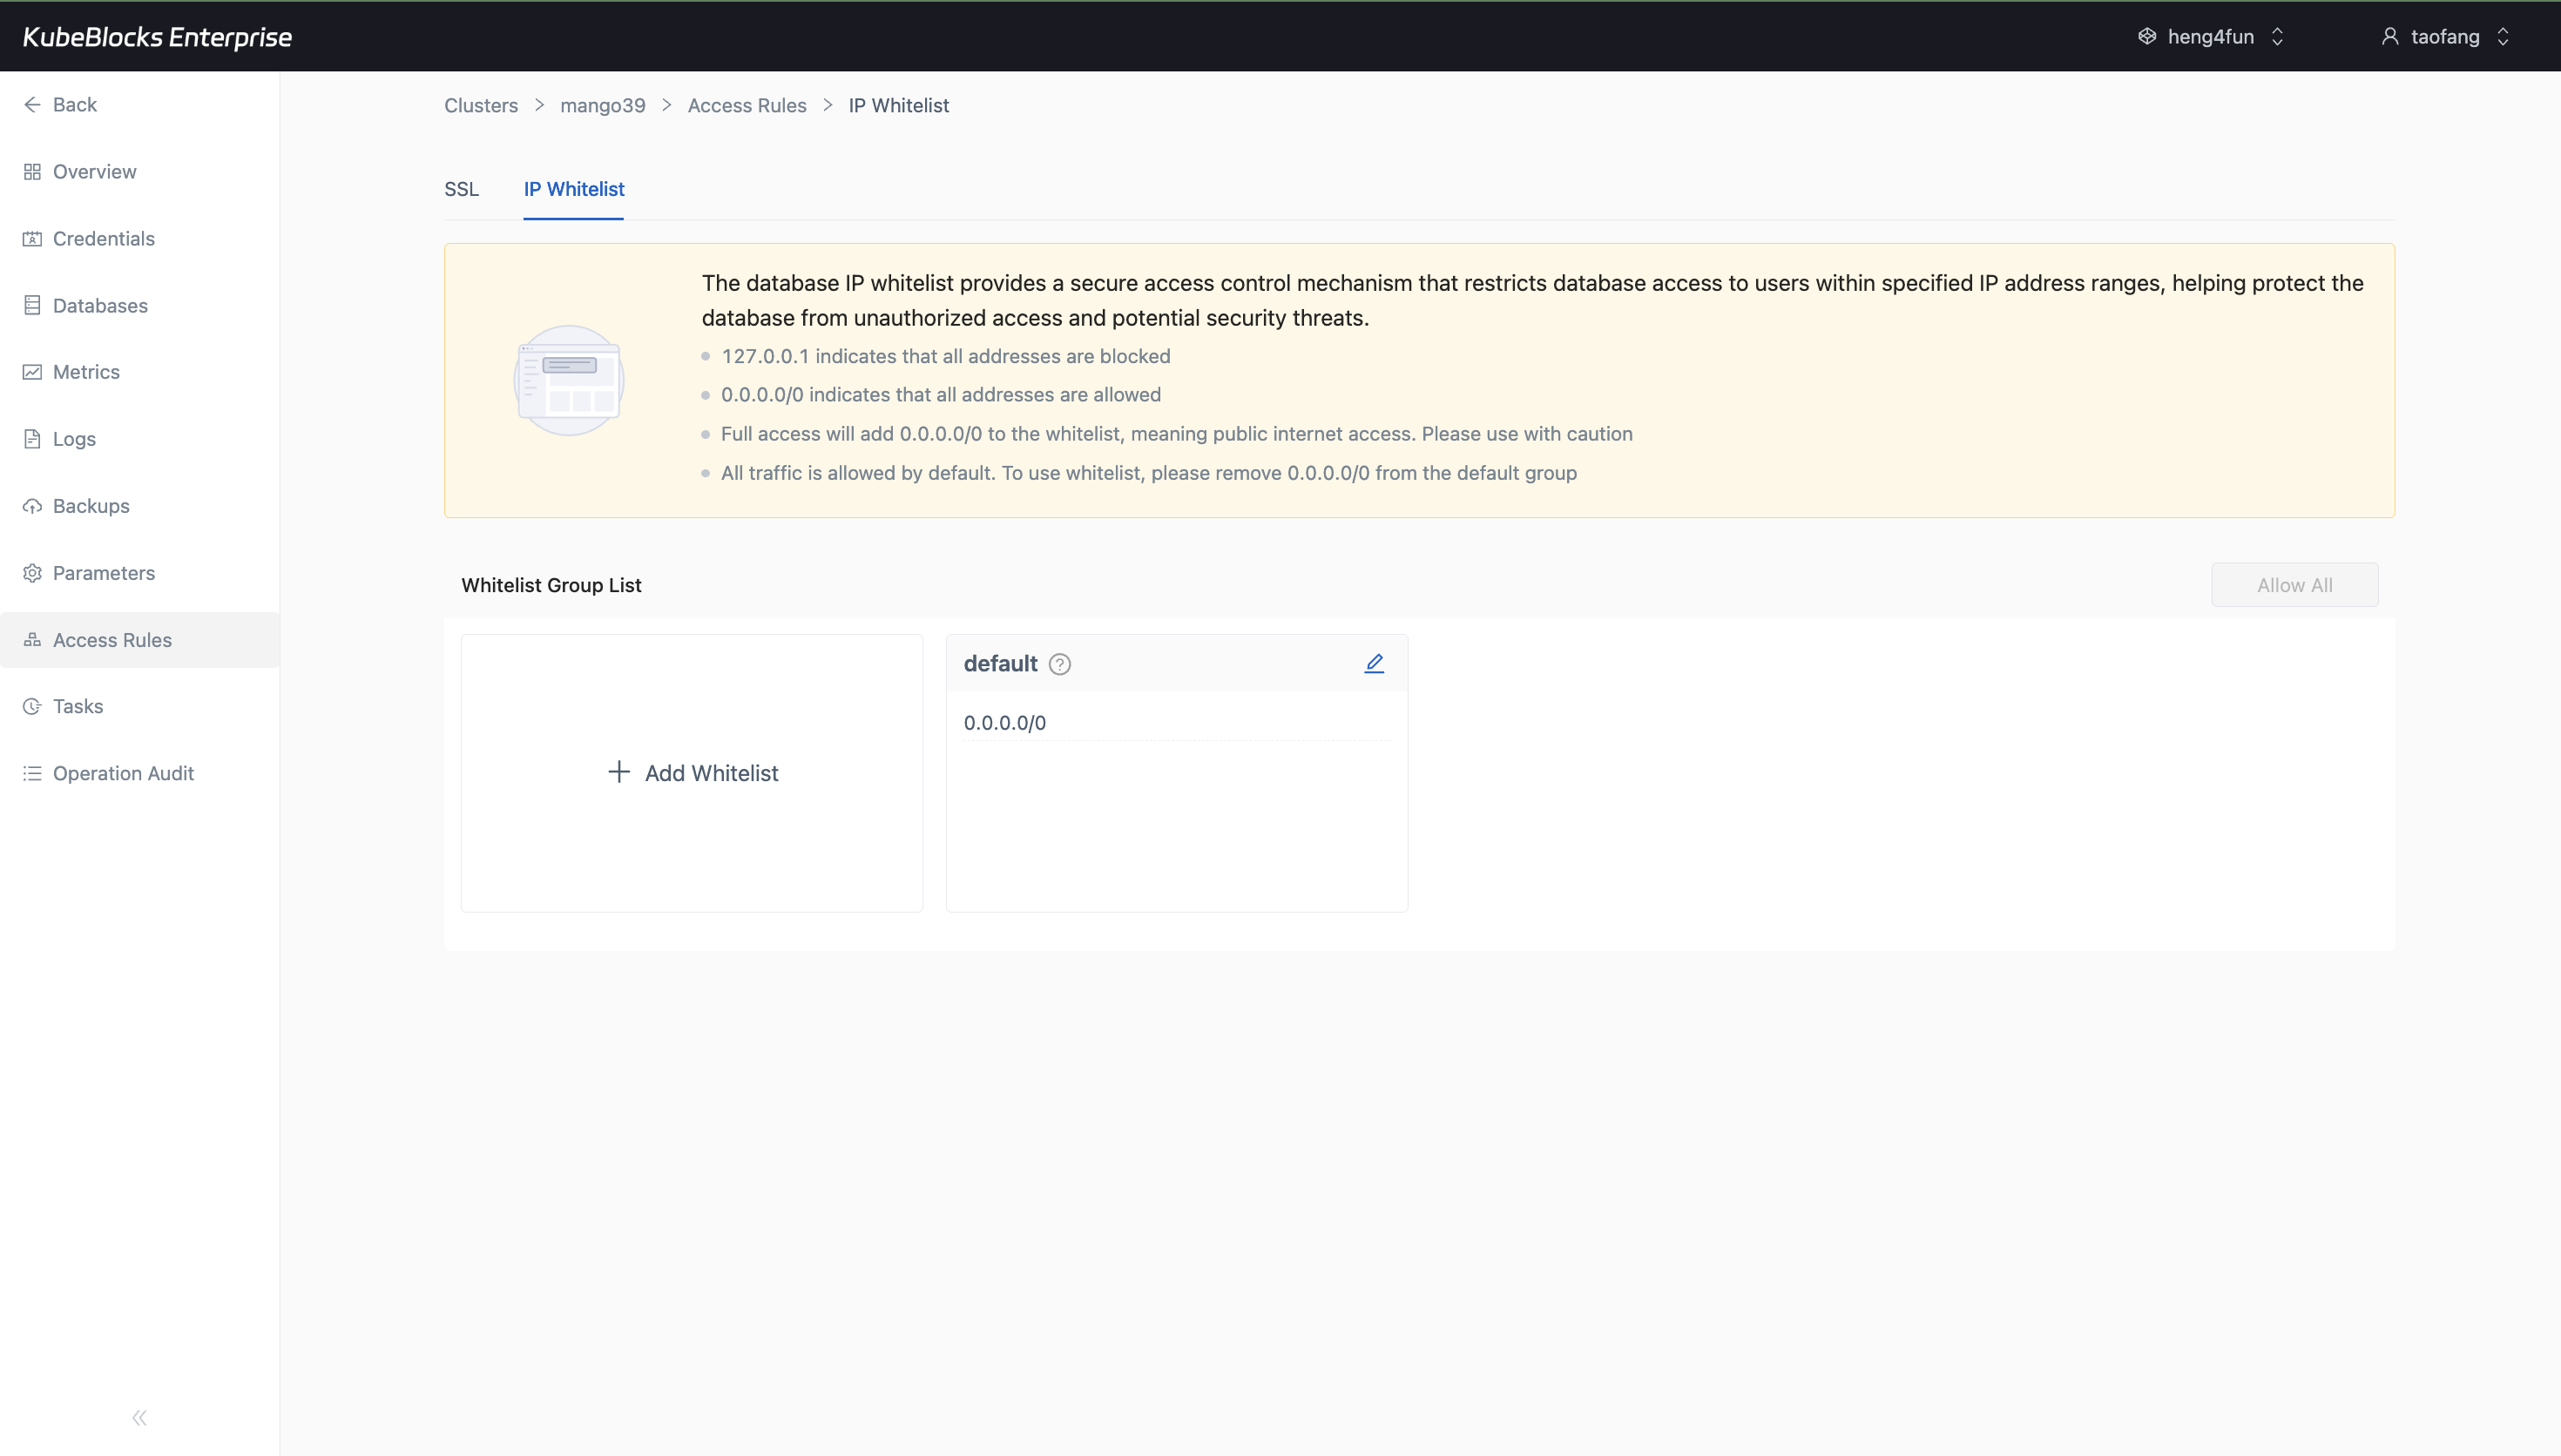
IP Whitelist makes ClickHouse network access explicit with default rules, CIDR guidance, and an Add Whitelist entry point.
Control ClickHouse network exposure with IP whitelists
Use Access Rules to review and adjust the IP ranges allowed to reach ClickHouse, with built-in guidance for blocking all traffic or allowing broad access.
- Open the IP Whitelist tab from the same cluster workspace used for lifecycle, scaling, and monitoring.
- Review the default whitelist group and CIDR rules such as `0.0.0.0/0` before changing exposure.
- Add whitelist groups when users need explicit network-access boundaries for database clients.
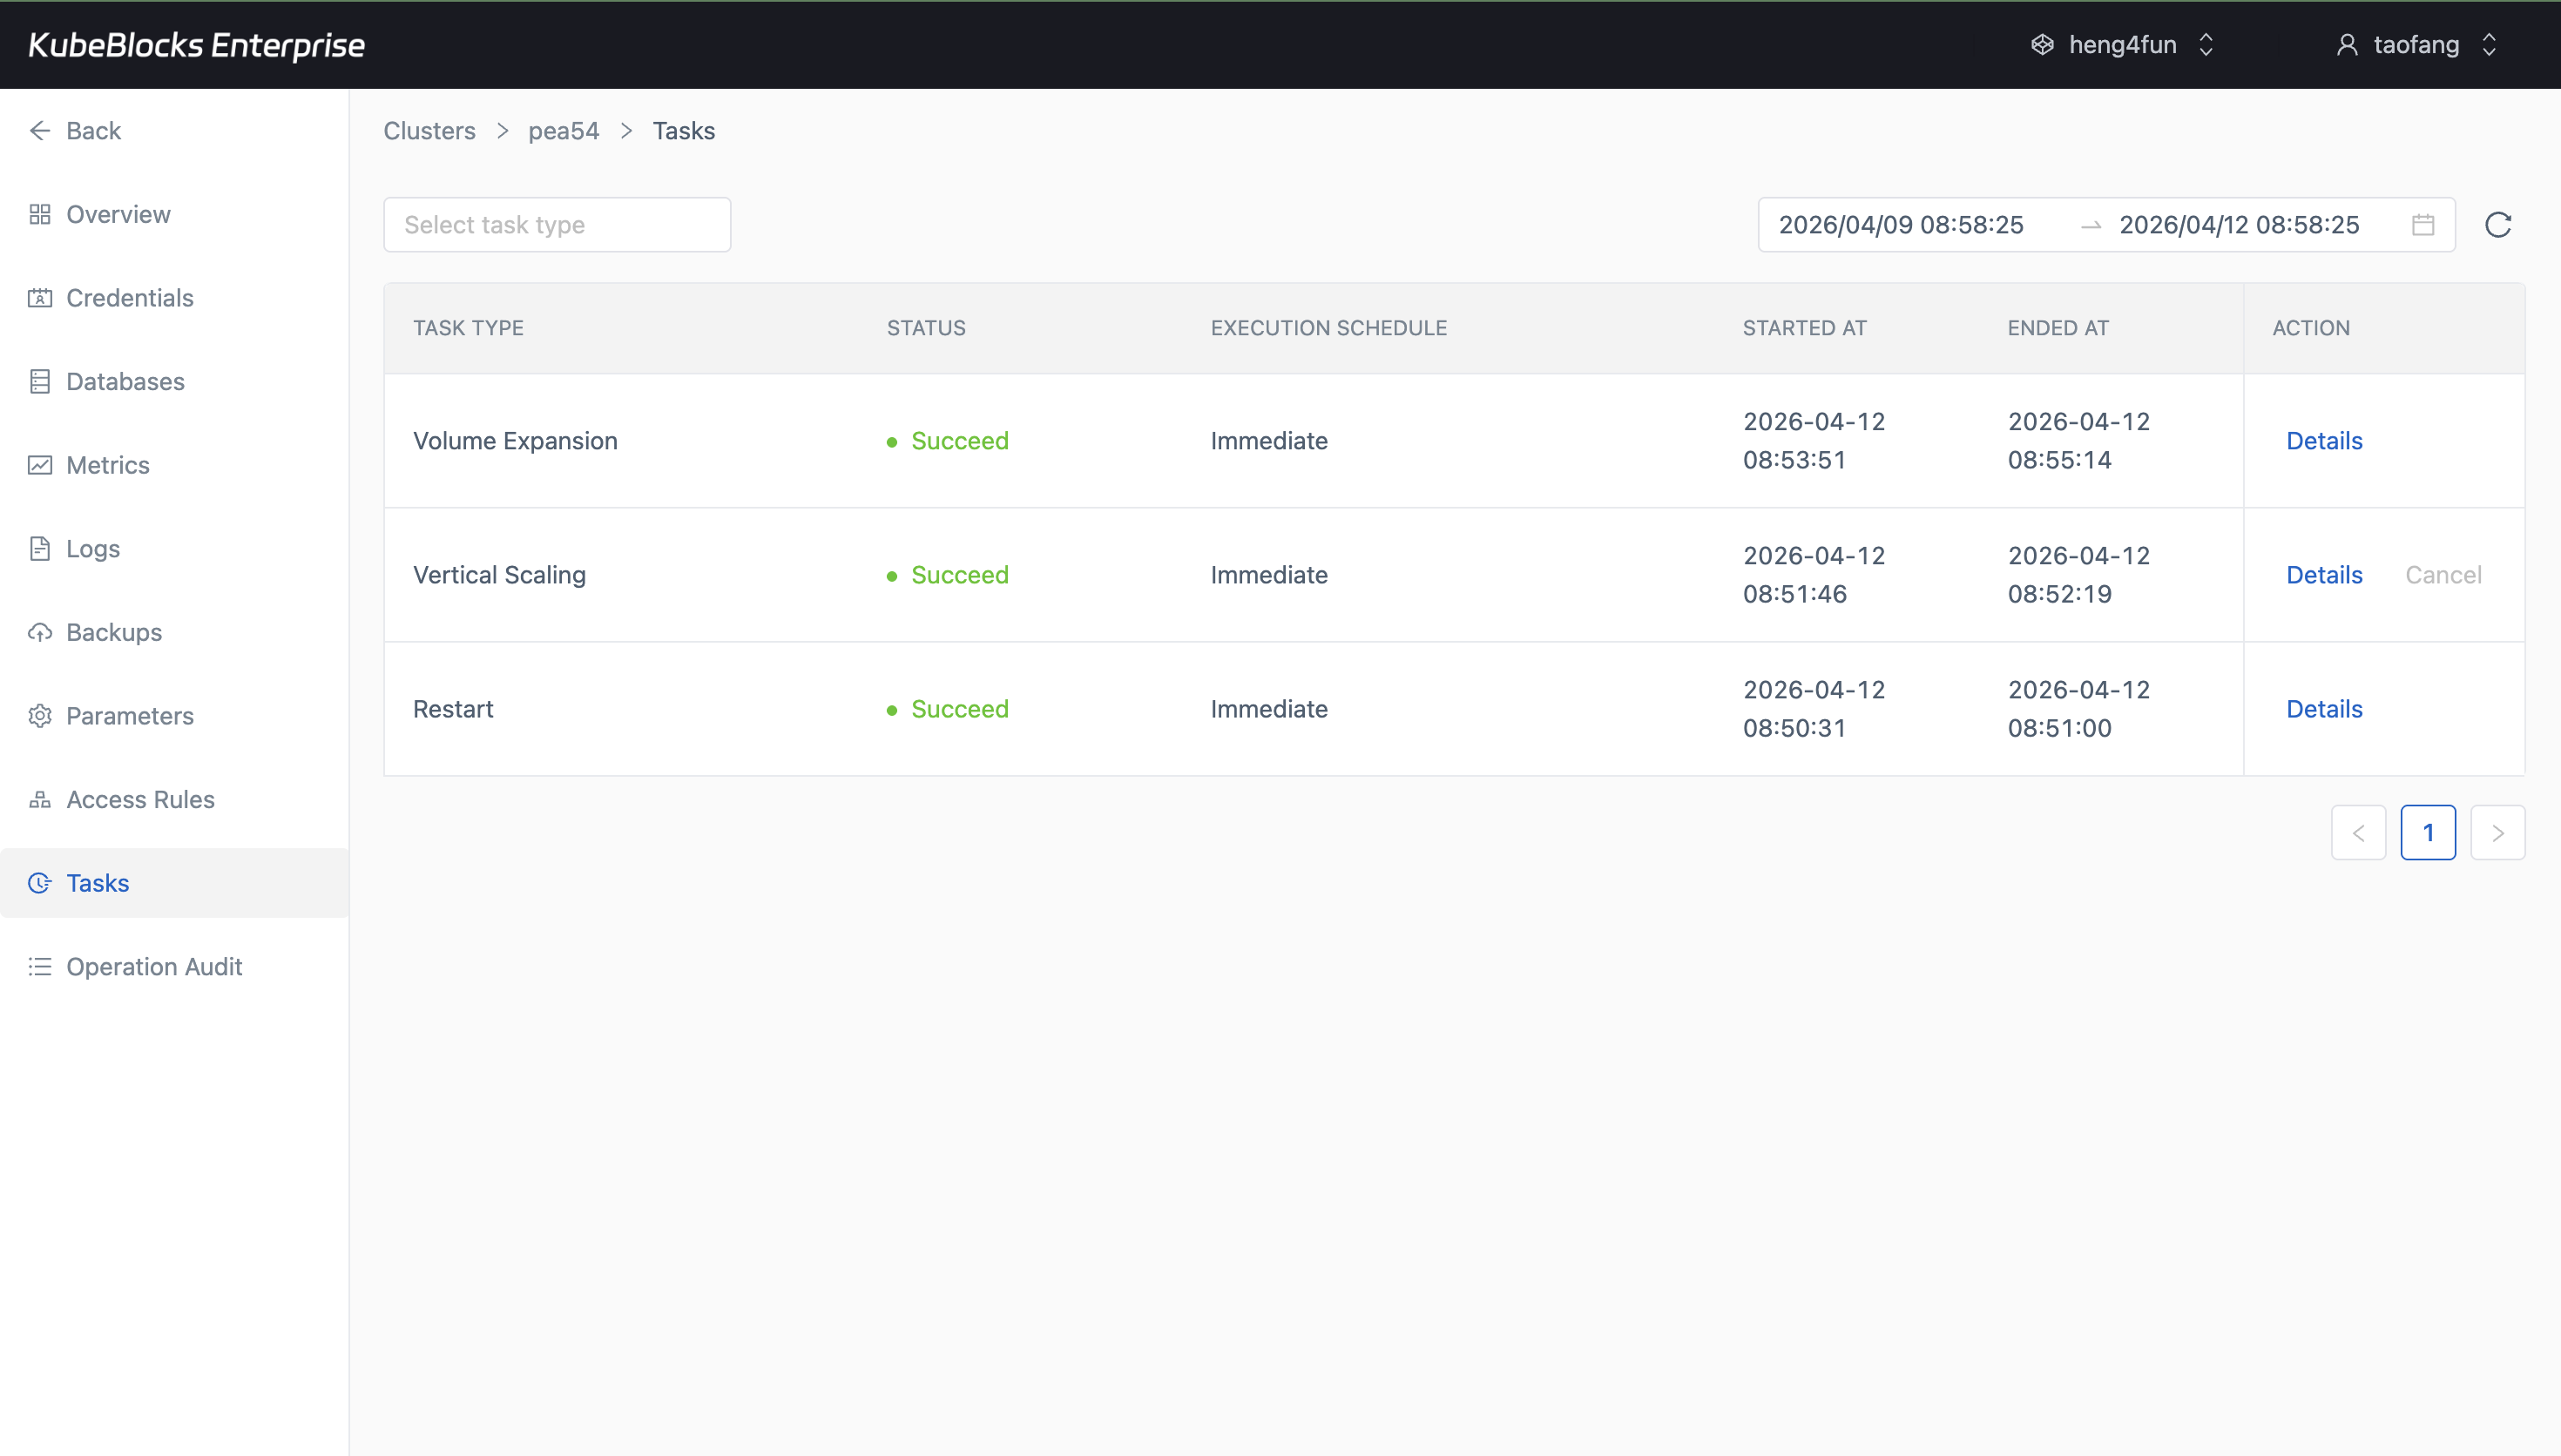
Task history gives teams a simple audit trail for ClickHouse lifecycle and capacity changes.
Review operational history from task records
Task history keeps cluster changes traceable so users can confirm what happened before handing ClickHouse back to application teams.
- Review lifecycle, scaling, backup, and recovery activity from a single operational timeline.
- Use task status as evidence that a day-2 change completed successfully.
- Keep change tracking separate from monitoring and data-protection workflows.
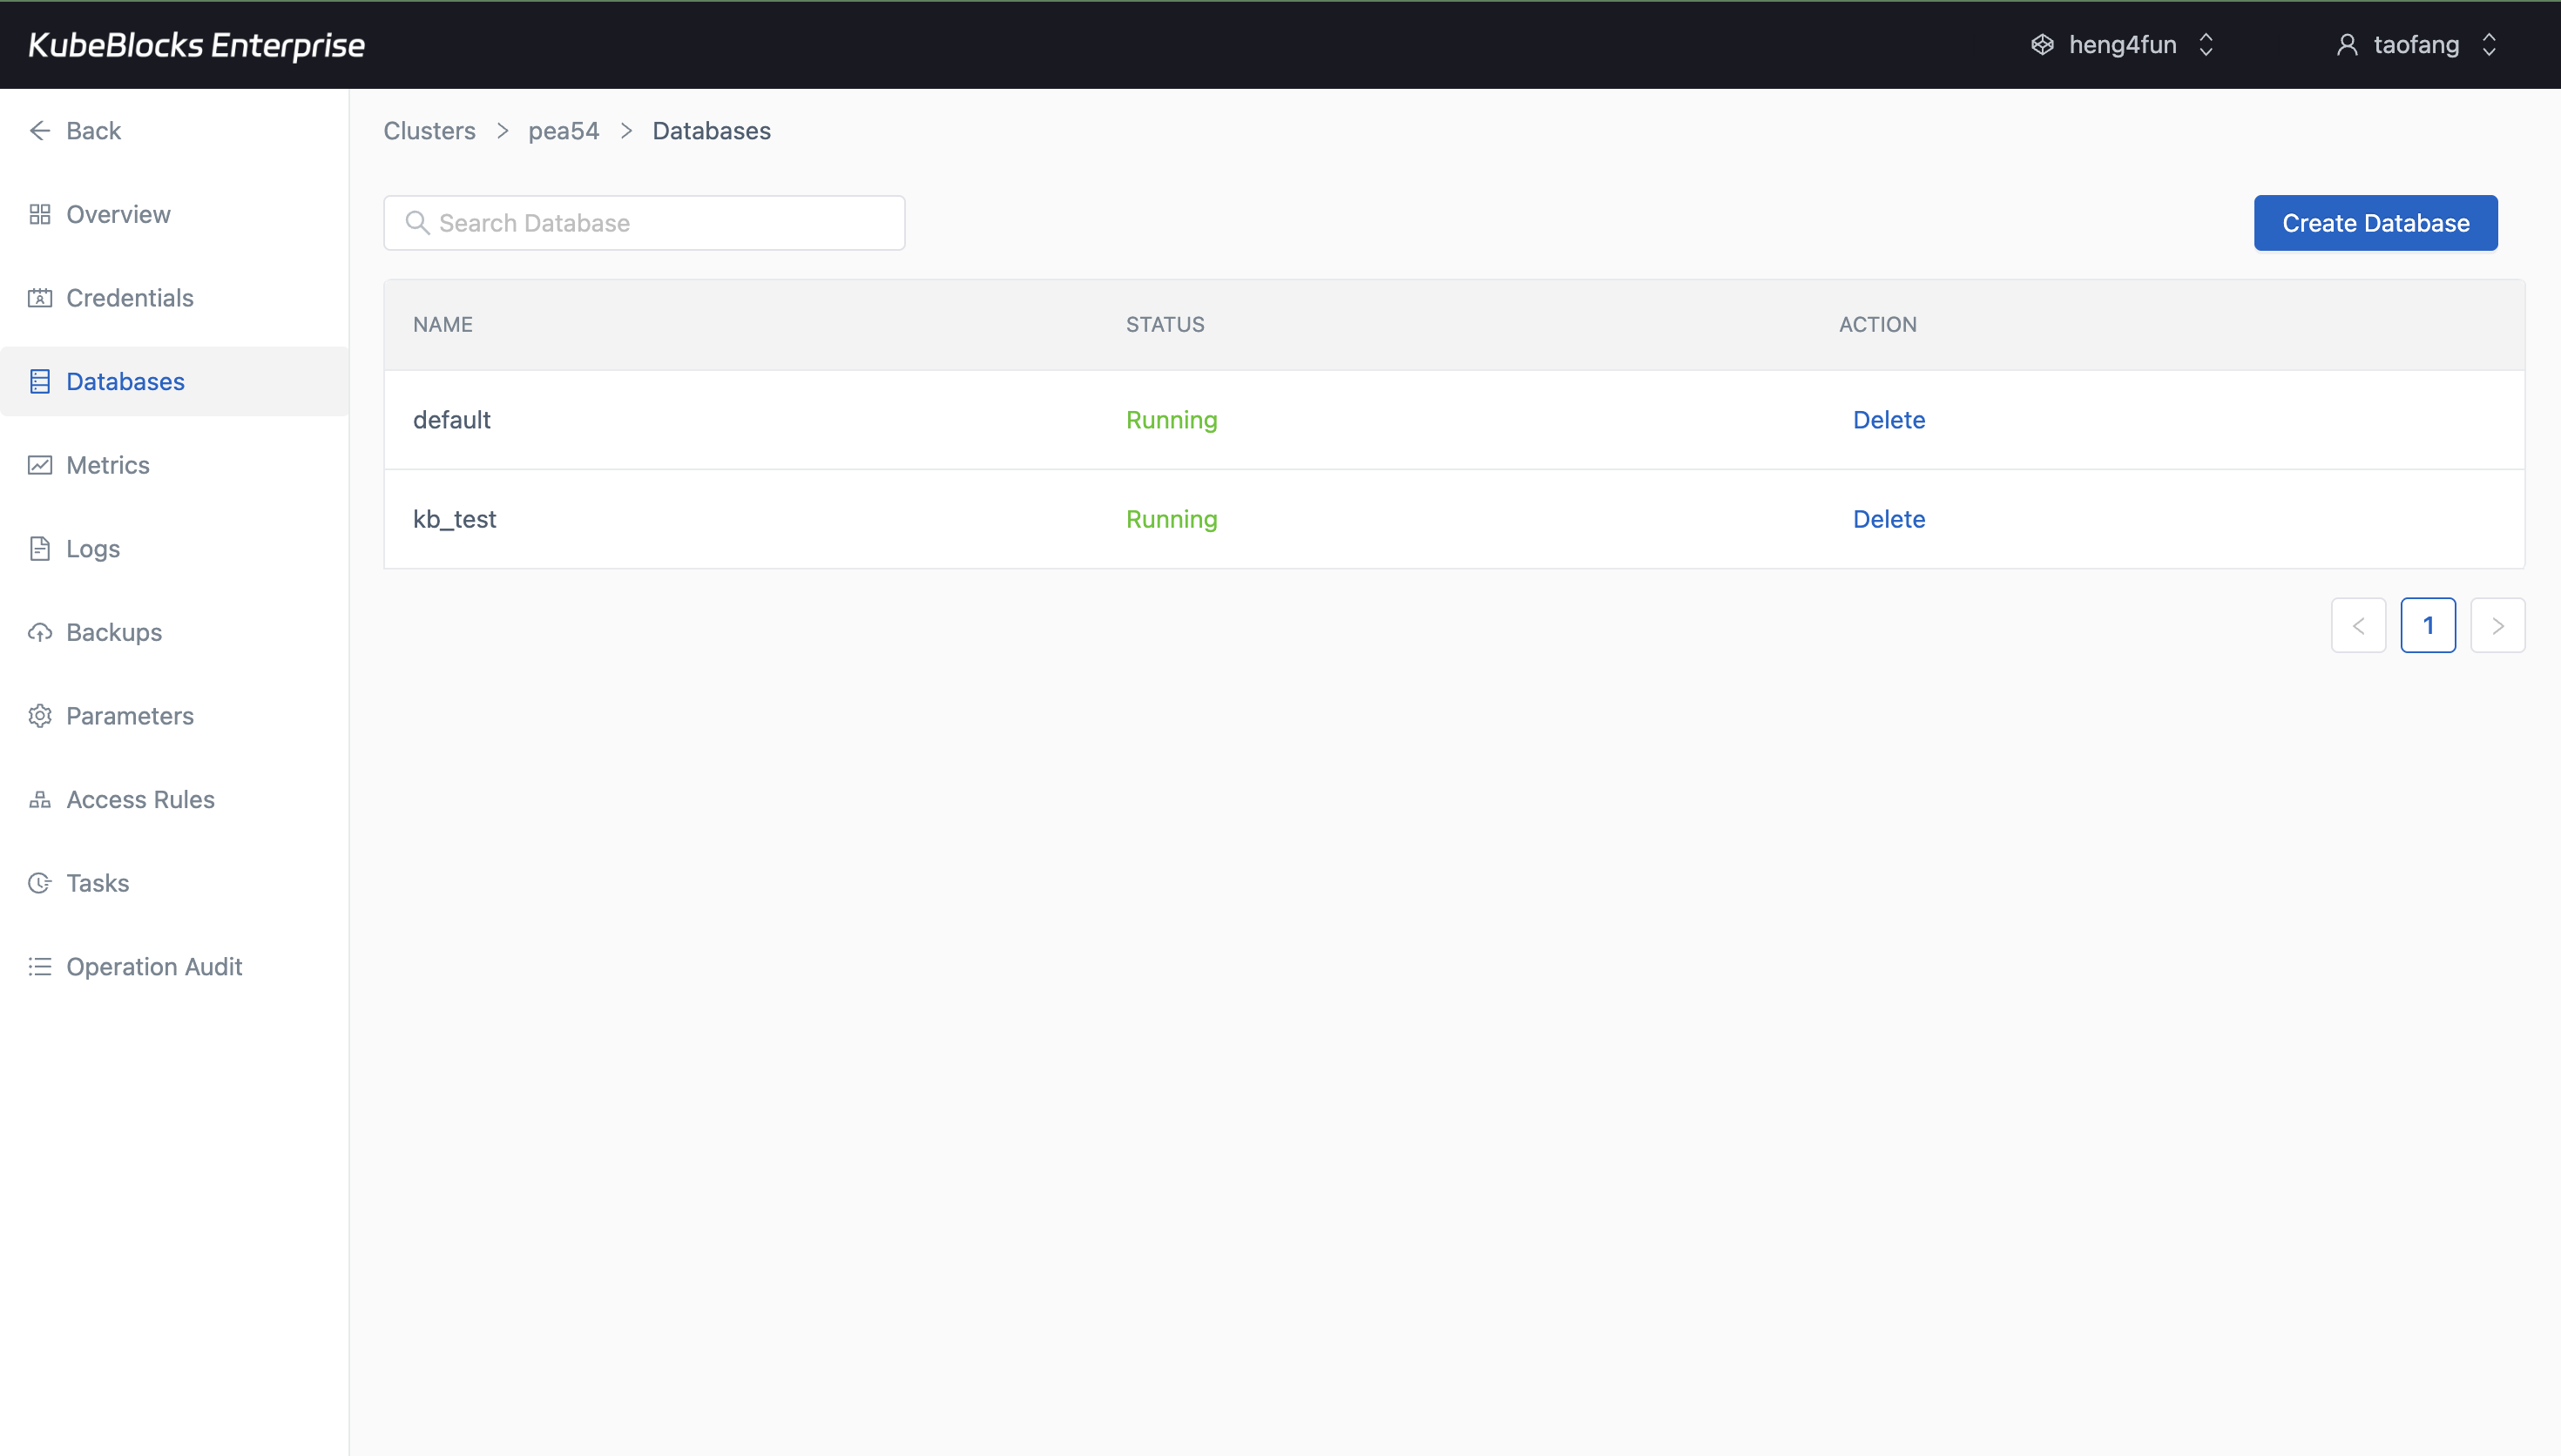
Database creation gives users a direct way to prepare ClickHouse namespaces for new analytical workloads.
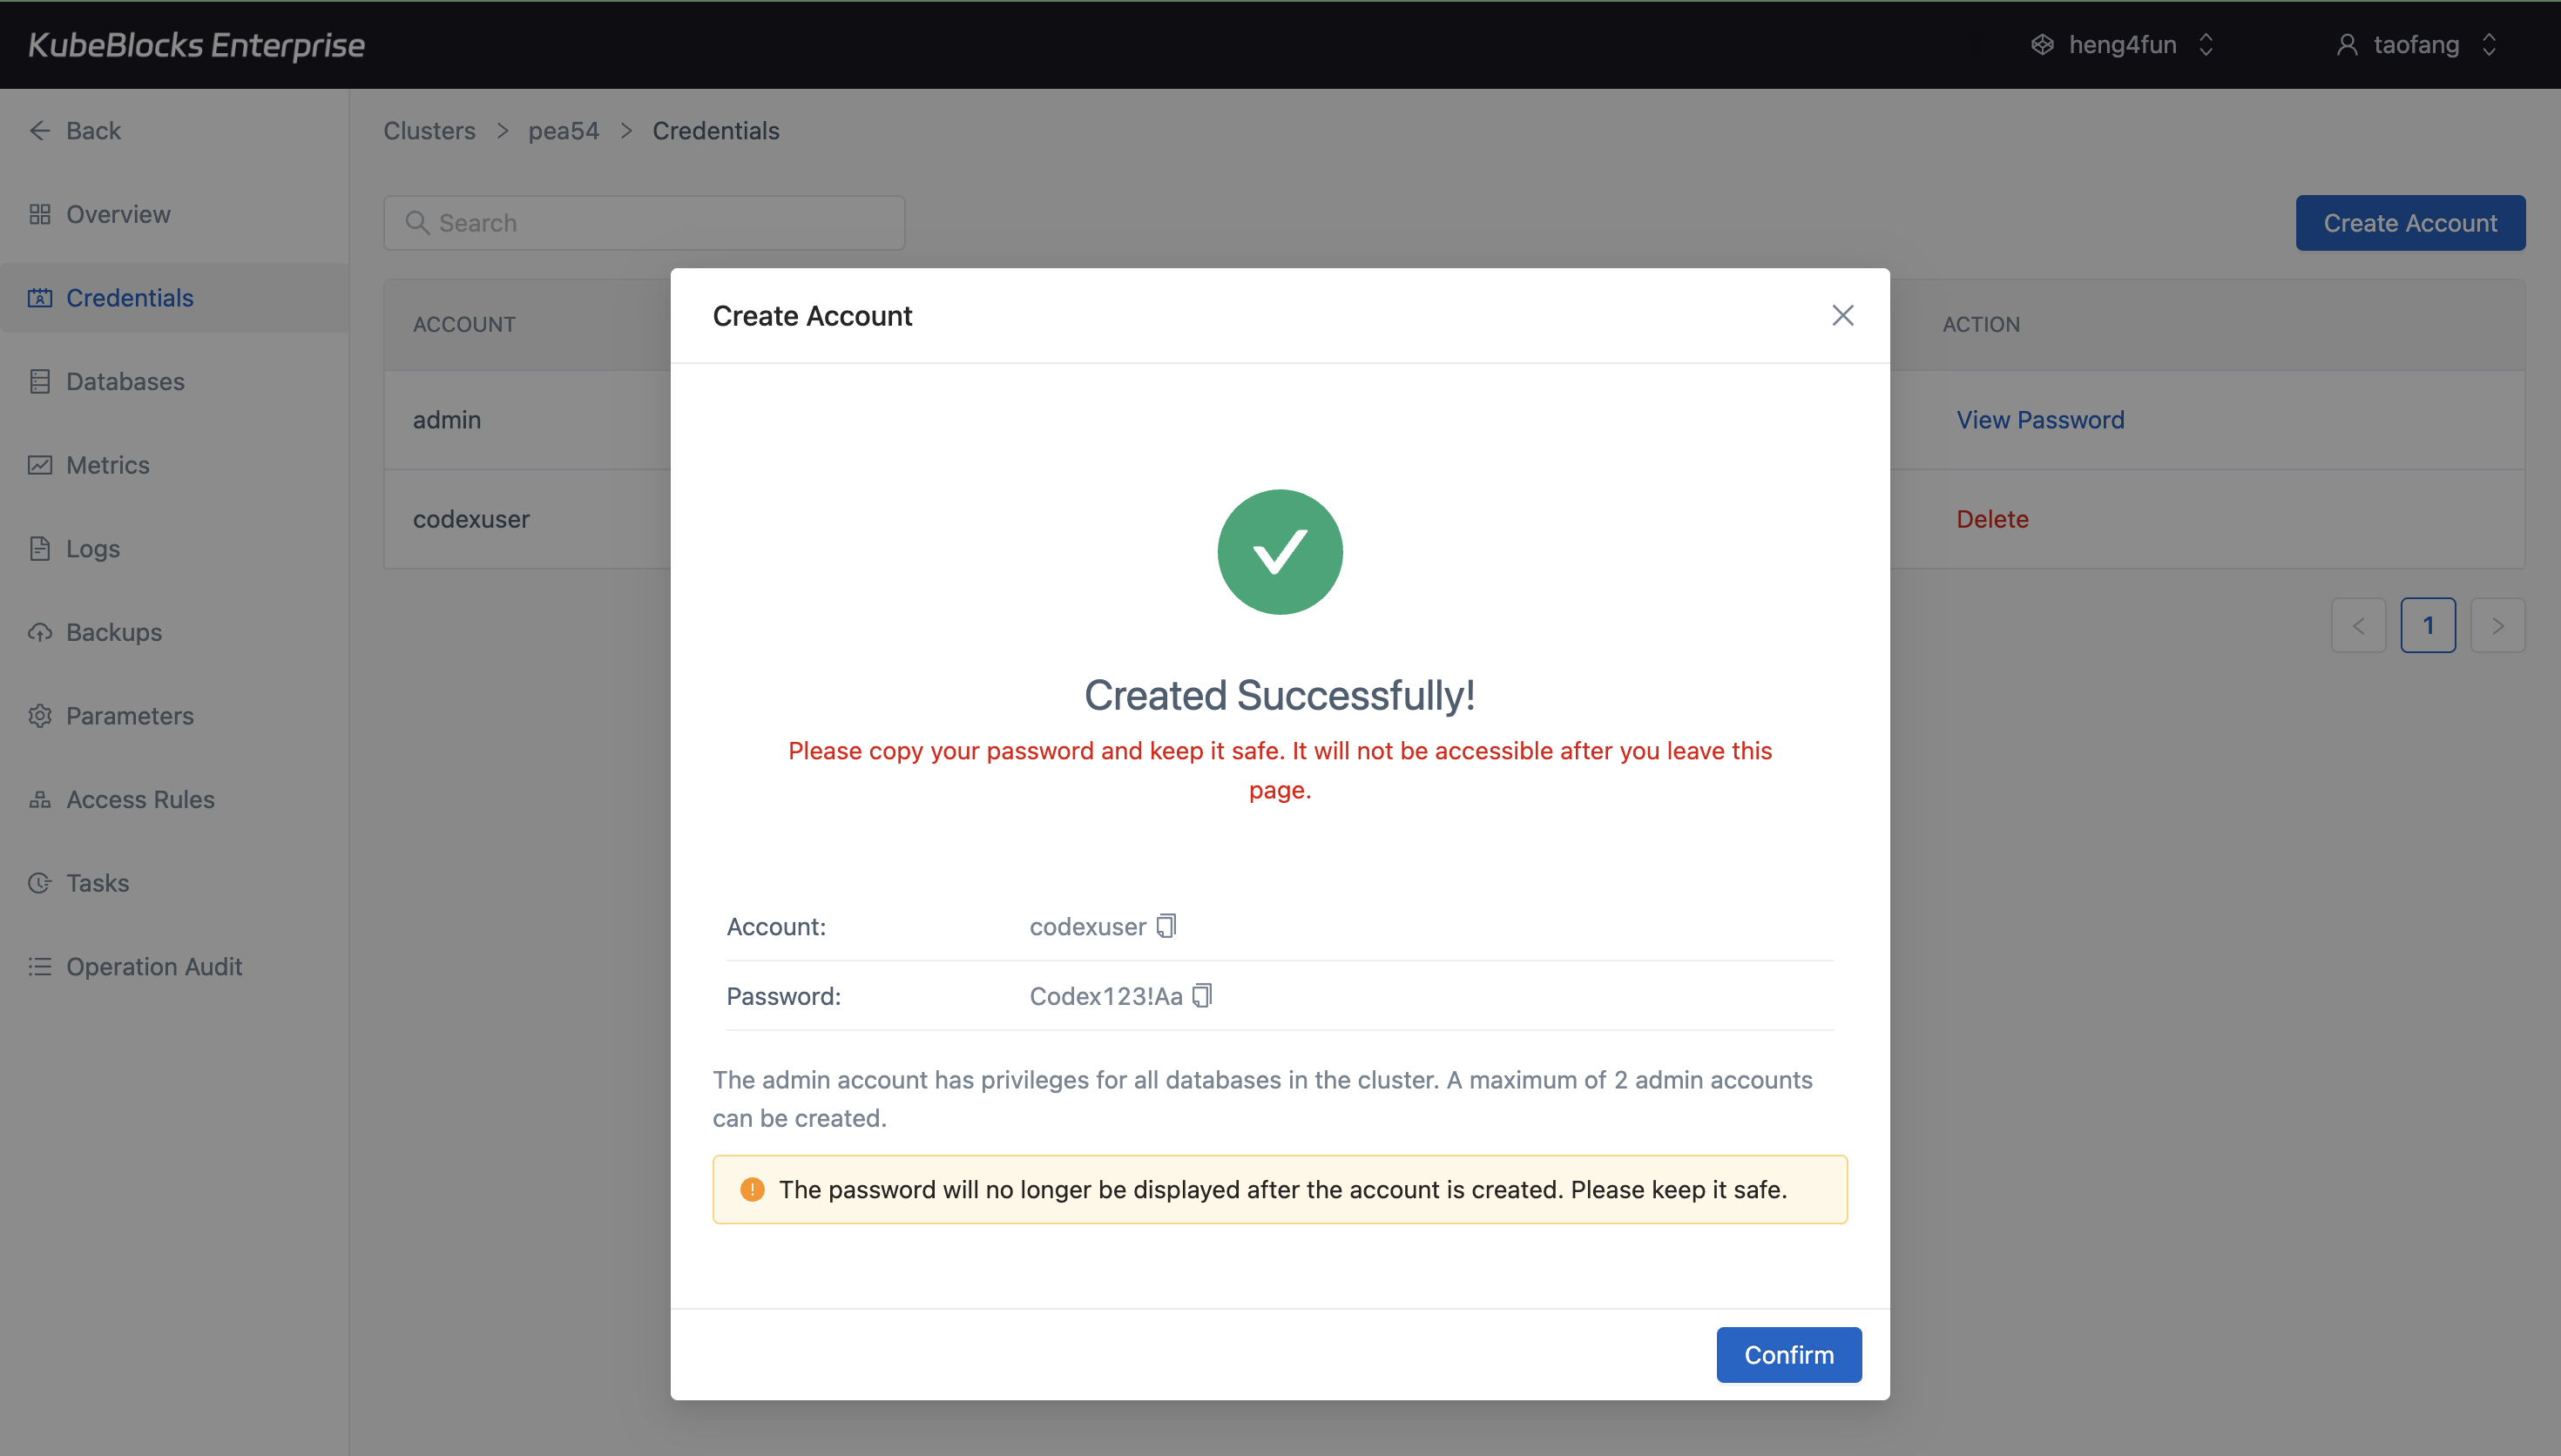
Credential workflows stay close to the database itself so users can move from provisioning to access handoff quickly.
Prepare databases and credentials for downstream analytics teams
Use the built-in Databases and Credentials pages to prepare ClickHouse for application teams. The tested console surfaced database and account creation, but no query workbench route.
- Create databases such as `kb_test` directly from the Databases page.
- Create credentials from the Credentials page and hand one-time secrets to application teams securely.
- No SQL or Query Workbench entry surfaced in the tested ClickHouse console flow.
Want full Day-2 operations on Kubernetes? Supported by KubeBlocks ClickHouse Kubernetes Operator →
Ready to build your own DBaaS on Kubernetes?
Talk to our team and see how KubeBlocks Enterprise can help you consolidate databases, strengthen security, and reduce operational costs.